
Case study on $NOW (service now) flow from blackboxstocks EXPLAINED
The great thing about Black Box Stocks is we have all the information available with many eyes and ears looking at the same thing. The more people you have the more inputs you’ll have from flow.
$NOW was a really good flow play and I personally believe if the market was participating, it would have worked out well. I will take you step by step in this options play and may be a long read. But if it helps you, please send me a message or drop a line. I only ask you use my referral link by Blackboxstocks , a few bucks helps me along the way) Or you can send me some $DOGE haha.
This will be broken into parts
- Initial Flow – General information on things we look for
- Rolled out of the flow – When big money left
- The multi-leg play – Big money lowered their strike
- Big money ditched us – Every man and woman to themselves.
- What next?
Summary (at the bottom)
Initial Flow (Day 1)
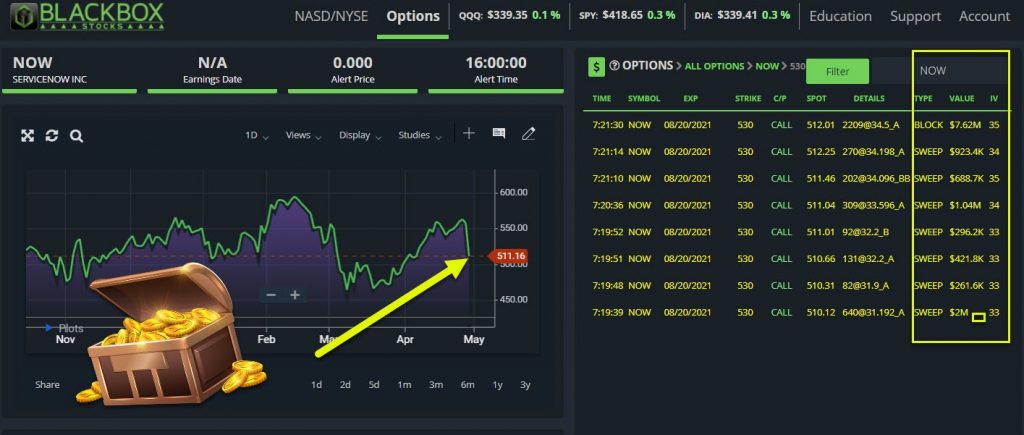
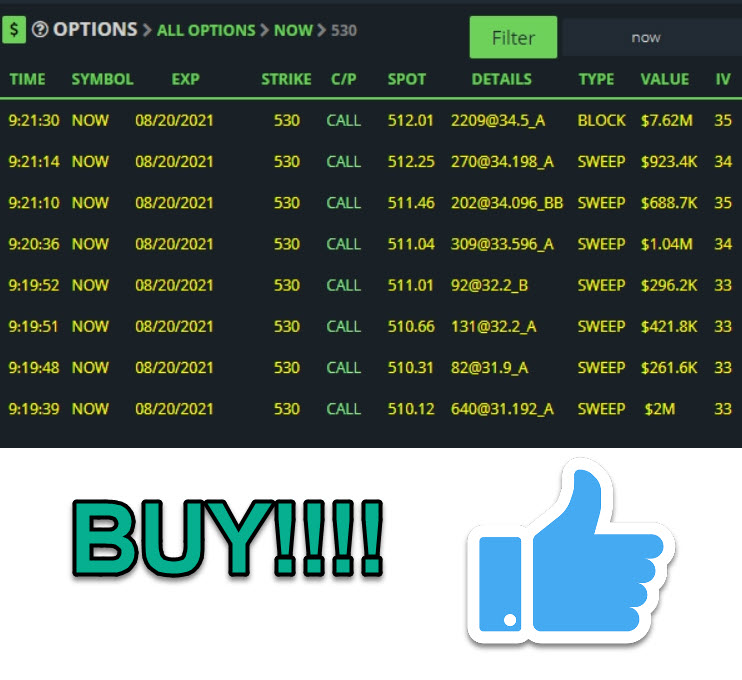
This flow is a 100% GO GO GO freaking buy it. Fits all of our criteria because the Size, Time, and Urgency. The right side you see that they put around $13M in flow on 4/29. We see a good size of ask sweepers that kept pounding it within a few mins. Note there are 2 bid sides there. Looks like a post ER play so you may or may not have touched it.
Repeat after me: “B” or “BB” is NOT always selling.
Nobody opened from 7:19:39 and sold at 7:21:10 PST.
The exchanges fill the order so fast that it hits bid side. The time stamps tell you that because this flow was in less than 2 mins. No one dumps $4M in flow and sells for chump change. They may sell it the next day but you’ll find that on a separate flow the next morning or afternoon.
The flow is yellow which means it exceeded today’s open interest in a single trade (sweep or block)
Side Note : If you were quick, you could have added around $32.20 and sold around $34.50 when the last block came, you would have made a quick buck there.
Follow me so far? Some guy put $13M in 2mins because he/she/robot wanted to get in ASAP. Someone in the back did their homework blah blah blah.,,.we don’t care WHY.
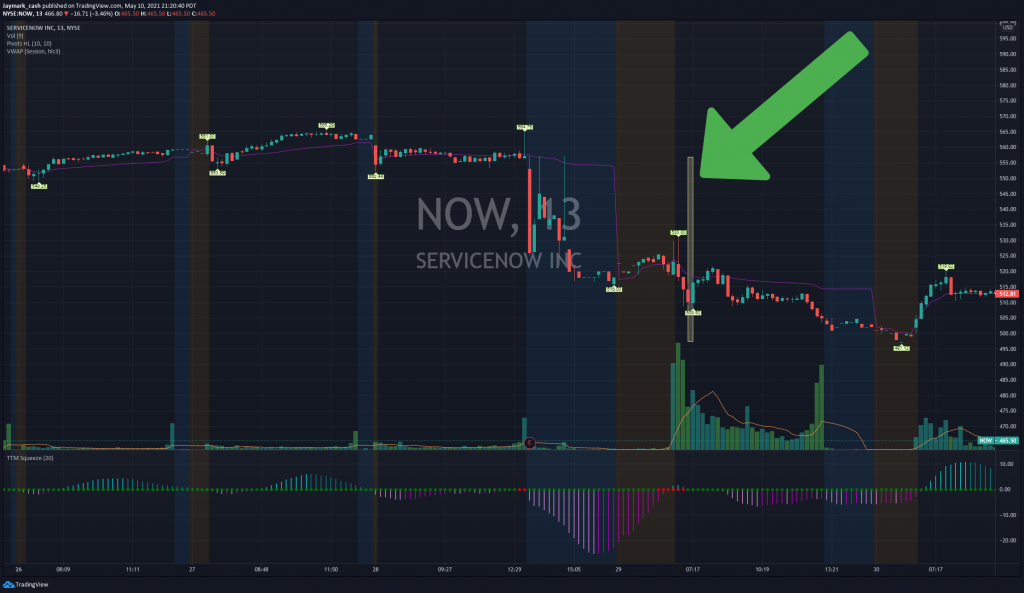
Figure A (Note : The huge line is NOT the candle, it’s just to highlight)
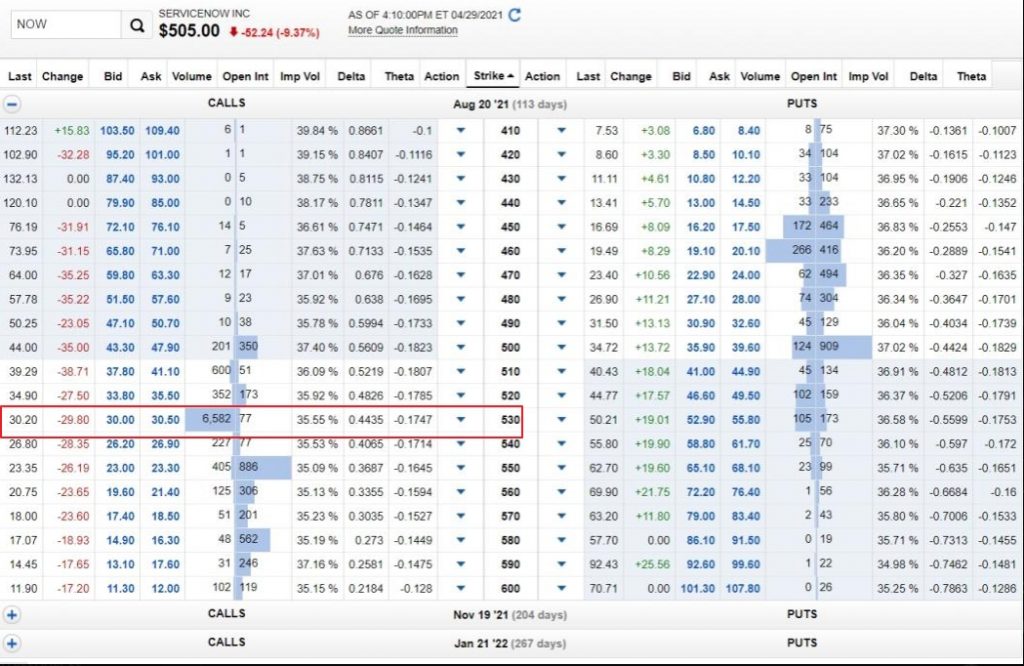
Figure B (OI of flow)
Now in the chart (Figure A) you see exactly where they entered by the huge green arrow.
The OI on the day of shows us 77. Open interest only updates once a day so you need to check the day of or us TOS to see historical OI. Almost 95% of the time we can already tell they are opening a position. But to make sure you can check OI (optional)
So far all we did is get in the flow and now we wait.
Day 2
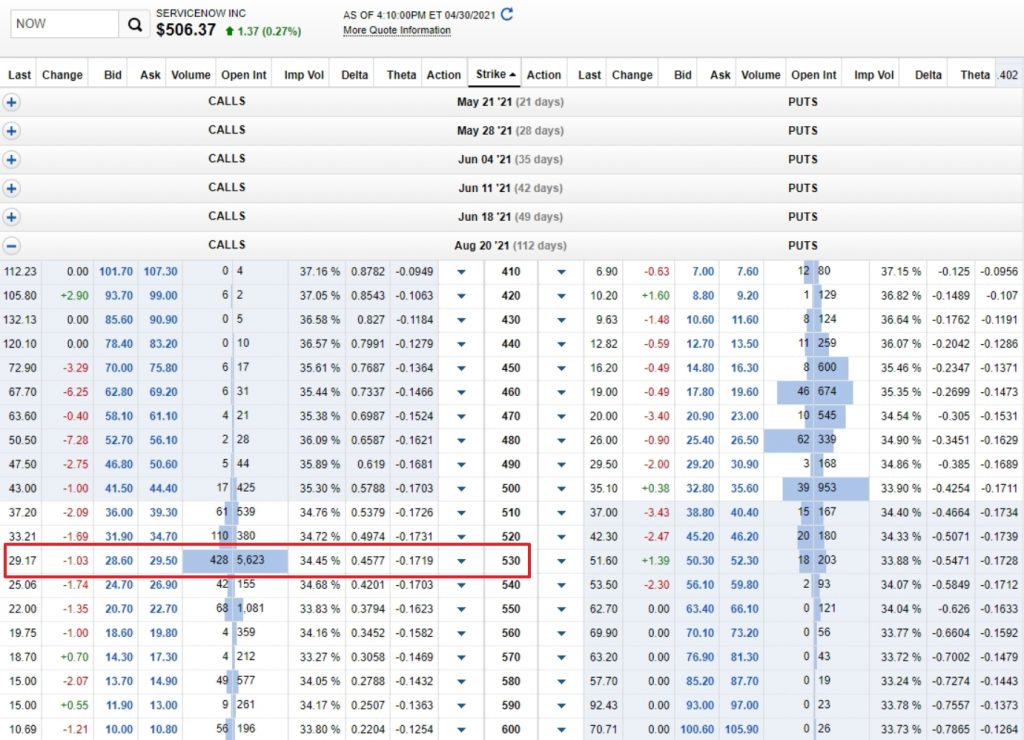
Following day open interest confirmed at 5,623
If this was good flow, it would eventually get you green and this is the end of the story
Rolled out of the flow (DAY 7)
Note: We are still RED on the position
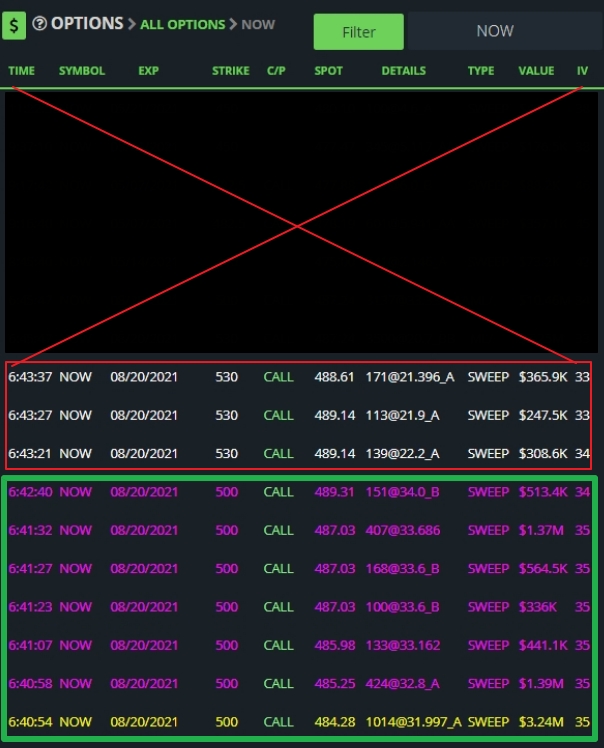
So right after open, we see that they started hitting the 8/20/2021 $500 calls. At first this is good flow again. Everything checks out but when things like this happens, you need to question the flow because we just had flow a few days prior right?
I blacked out the top for the last piece of information because let’s say you didn’t see the top part yet due to time. Let’s go from the bottom to the top
Green box – After market open on 5/4 they started to hit it and you can see that ask size sweeper for $3.24M. Another 2 mins go by and you see the contract price going up. Great sign overall and you know they are opening a position. There is nothing else to see because this was good flow, so assume we wanted to play this but if you’re already in, no reason to get another strike price.
Red Box – The hit the original ones again, with around $1M , this is a good sign usually if you’re already in a position.
However were they really adding?
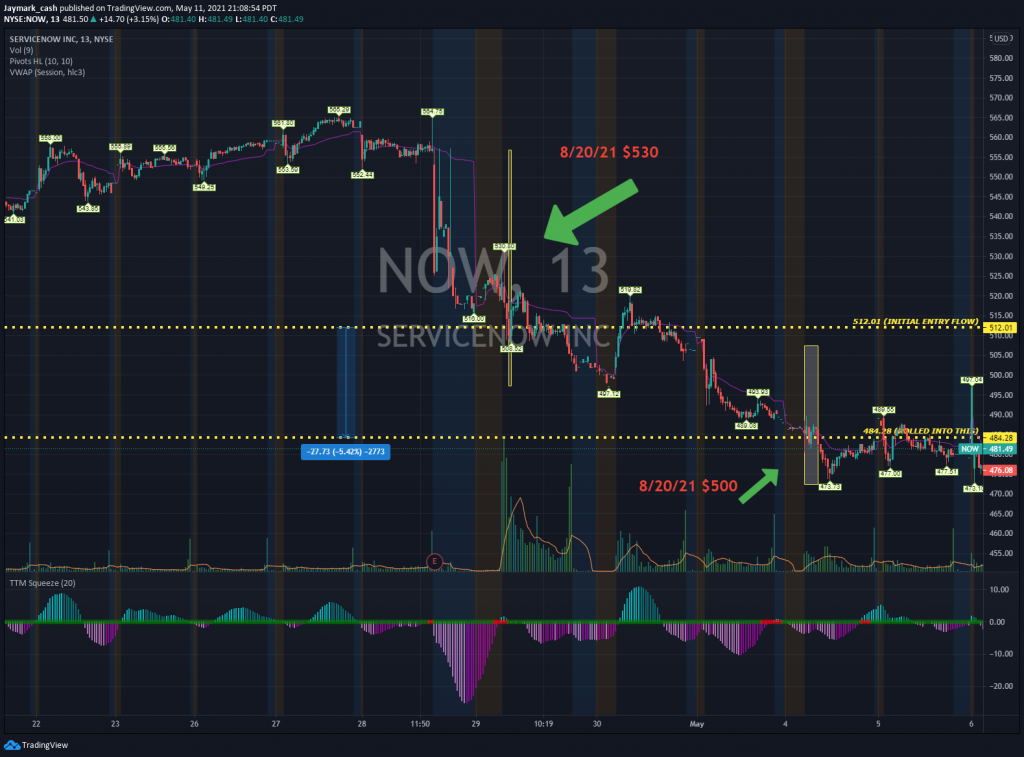
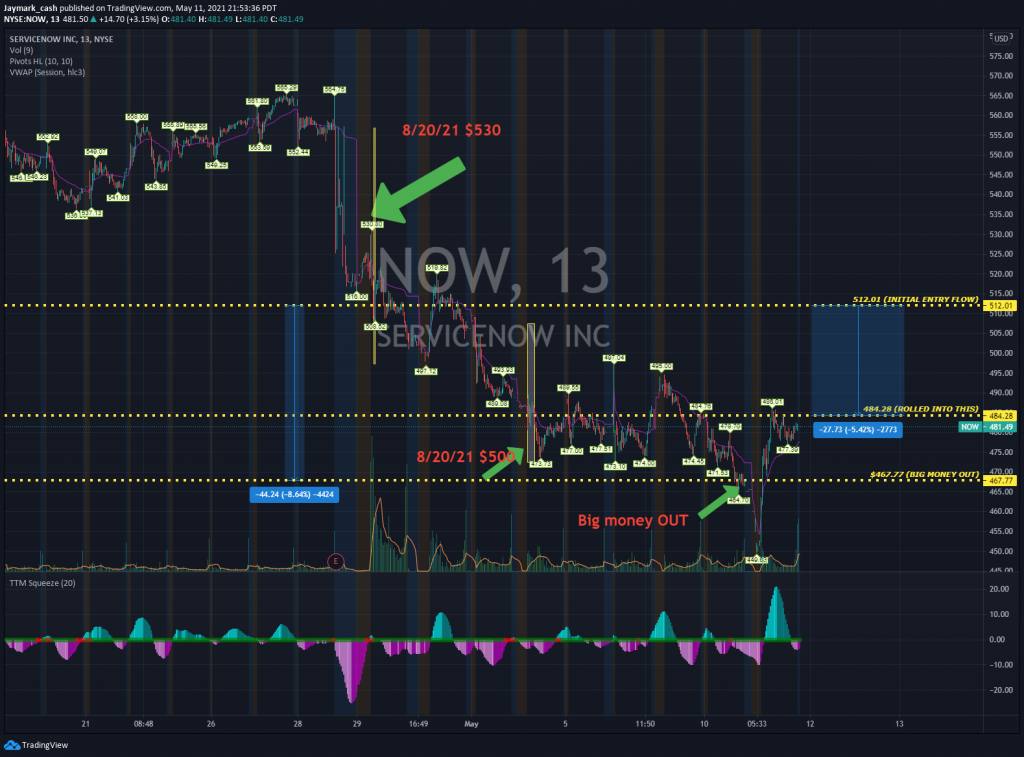
Let’s see the chart
The old arrow is on the upper left where they came in at the spot price of $512.01 and hitting the 8/20/21 $530.
You can see the underlying stock has fell -5.42%.
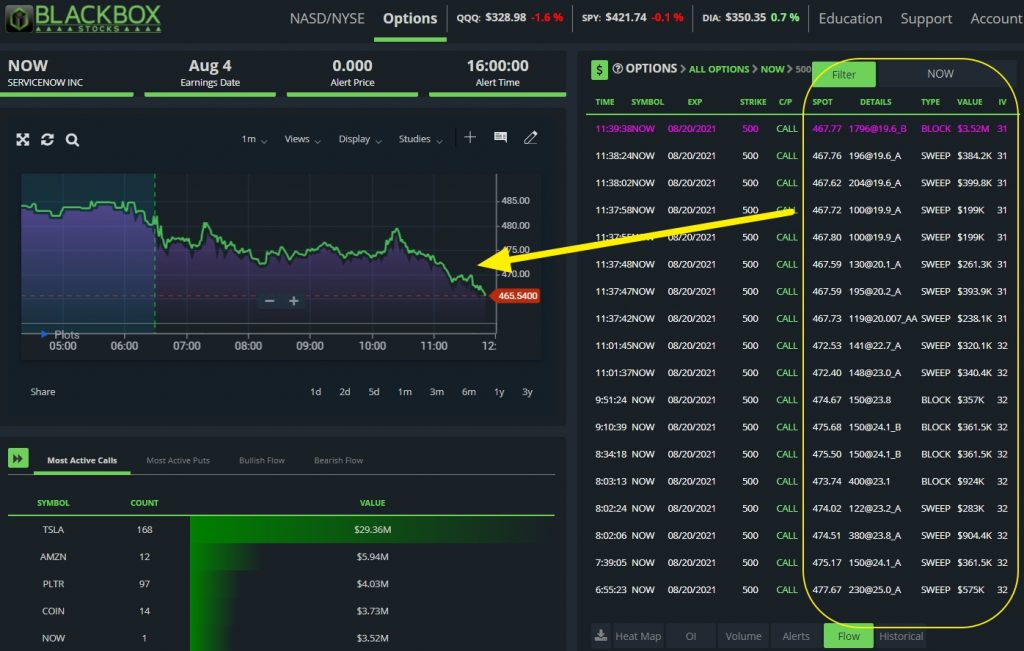
The new flow they were hitting was the 8/20/21 $500 calls with size. Everything about that flow is good until you realize the contracts were going the wrong direction.
Since there’s many eyes and ears in BlackBoxStocks, there will always be members who will notice what happens next.
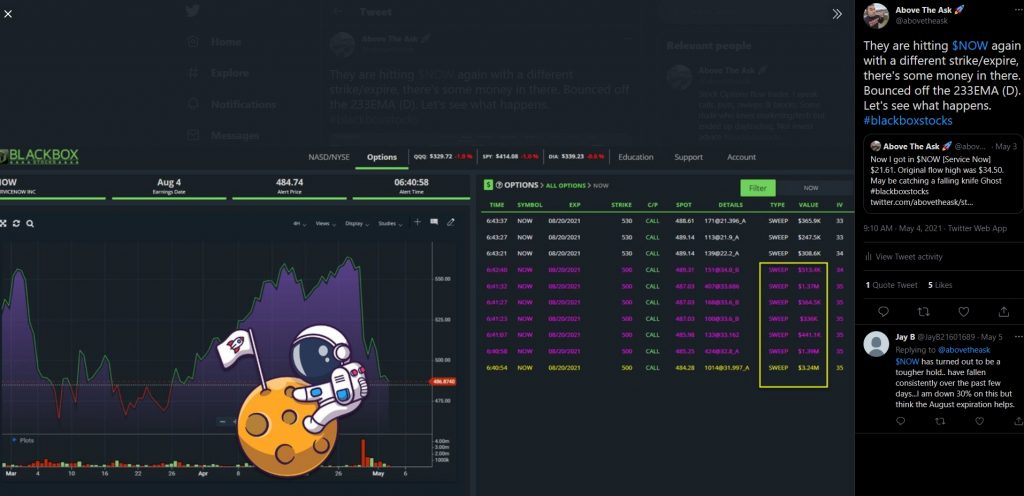
I personally didn’t notice it at the time….I even posted it on twitter. Thinking they were buying.
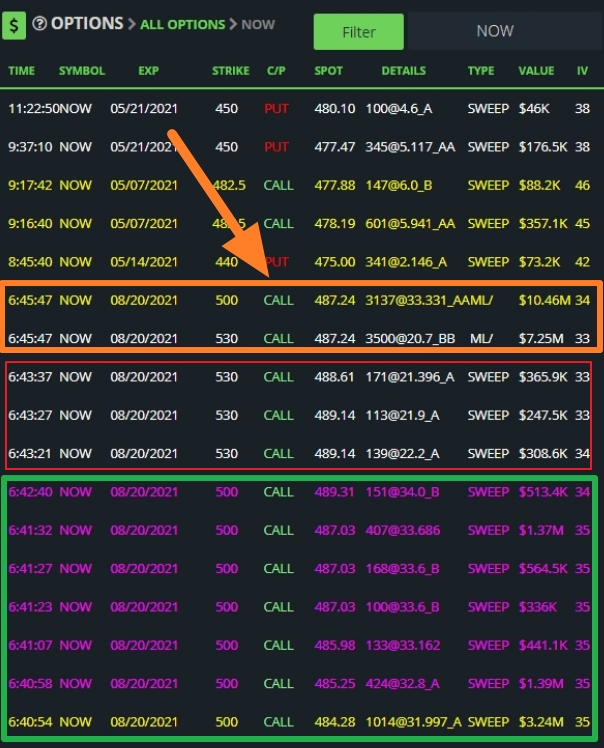
Here’s the verdict as we found out it was a roll, remember the black x on the top image.
MULTI LEG FLOW
See on the right side ML/ , this means multi leg. Which means they may have rolled it to a lower strike. Which by all means, they are down in a position and bought more time but paid the remaining premium. Since OI won’t show this yet, we kept track of it to confirm our suspicions.
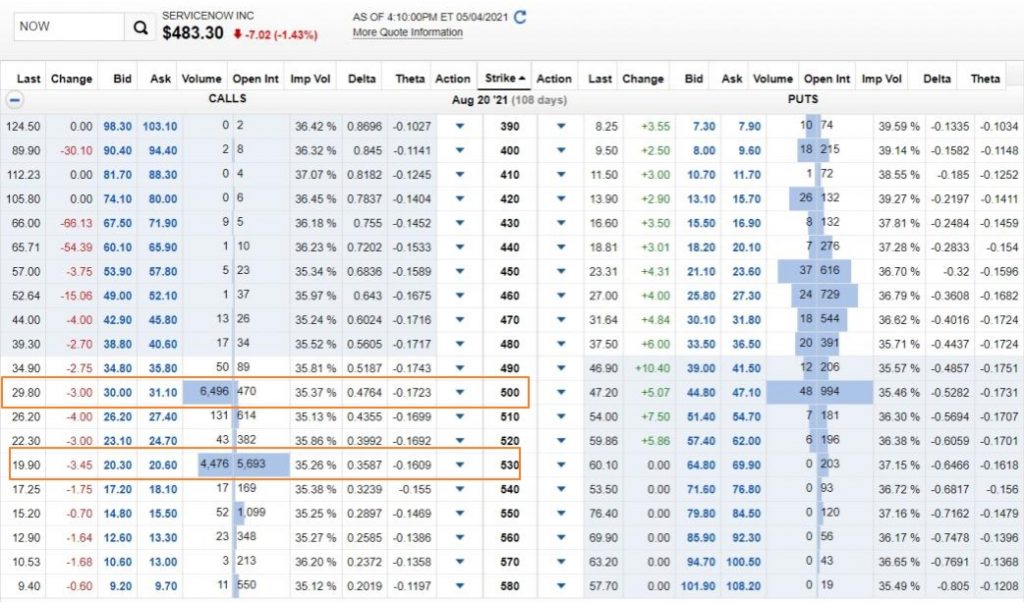
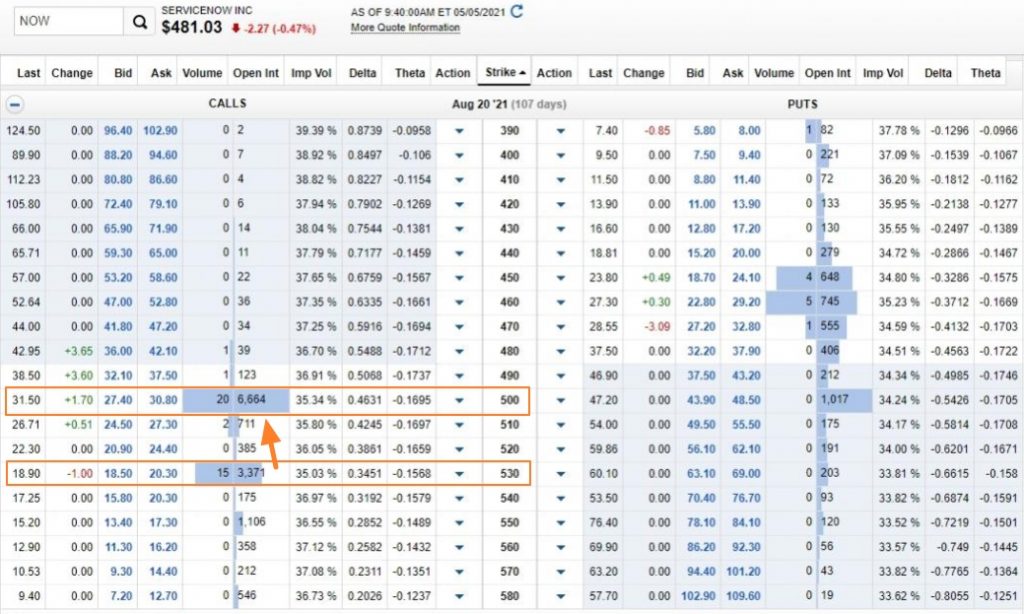
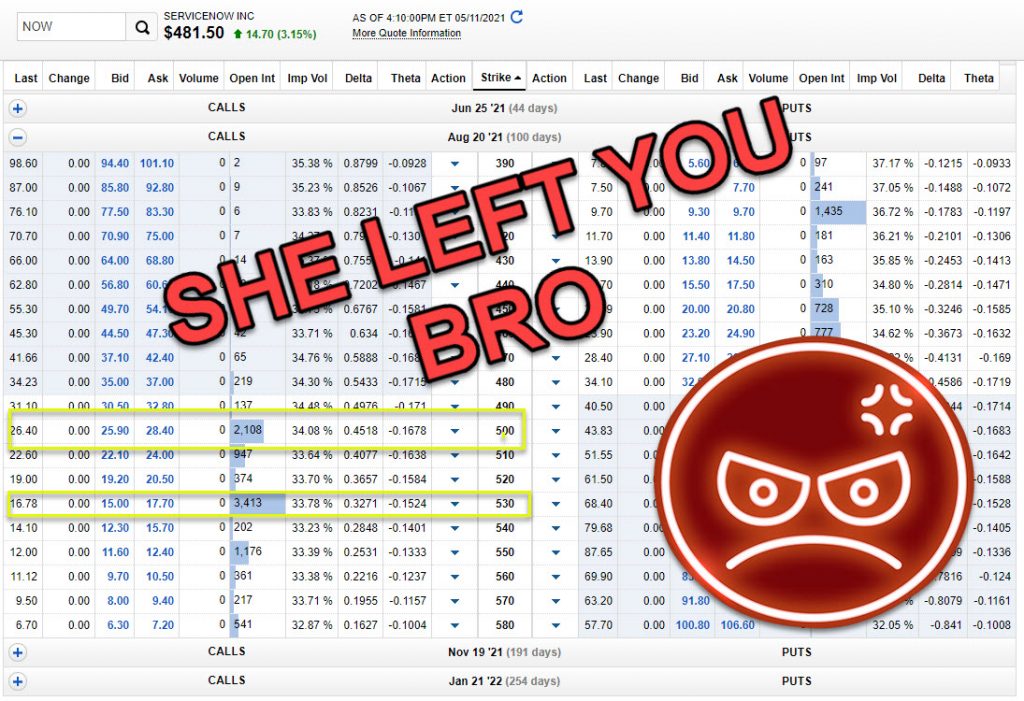
Remember the top image as this will show both the 500/530 8/20 for $NOW.
Following day, you can see a position was taken out from that strike
Usually when this happens, there’s still a chance it can STILL work and we just wait for a bounce and get out.
Your choice to roll or just get out
Big money ditched us on 5/10?
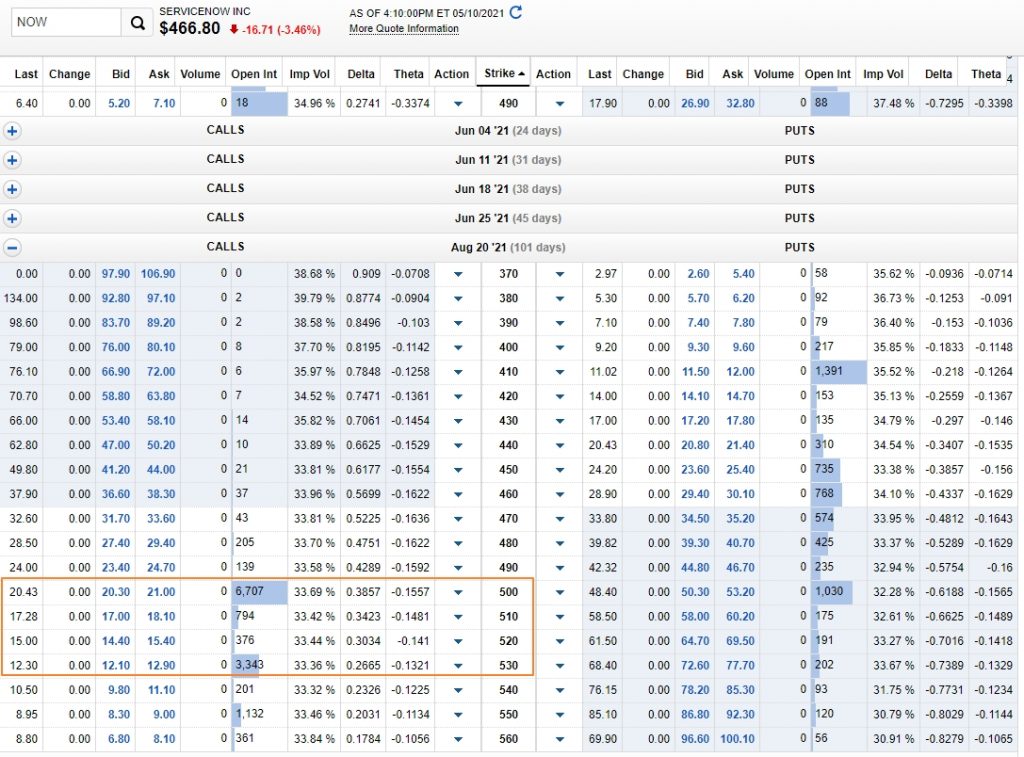
OI for the current day:
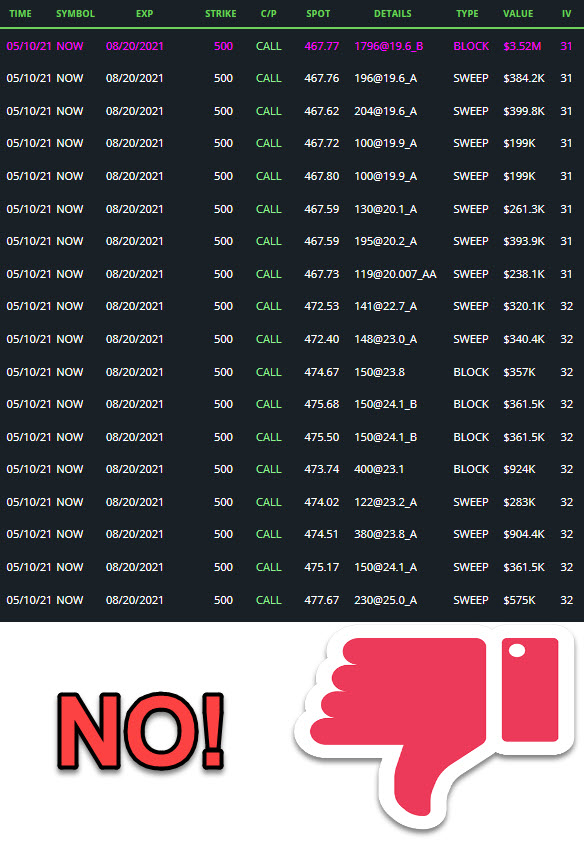
Let’s first analyze this flow.
It should stick out to you that it is “white” and by definition in blackboxstocks it hasn’t exceeded open interest for the day. You can also see they were unloading these shares throughout the day. From my own personal experience, I see this happen with white bid side from the whole day, not our traditional ground and pound within 2 mins. Why? Think about what happens when you unload too fast or with size? It may take a toll on the stock so it will cause it to drop. The original buyers and yourself do NOT want that. Remember if we saw this flow , we will NOT play it. It doesn’t fit our criteria.
We do NOT contradict how we read flow look. Stare at the contract price below.
- Contract price UP = GOOD
- Contract price Down = Bad
- Contract price not moving = don’t buy
Look at this difference of BUYING/SELLING
Try BlackBoxStocks.com and get 20% off First month!
Understand it now? The final verdict is on the next image…
We want to make sure our thesis is correct so we check the OI in the next post.
Again 95% of the time we already know what happened but just to make sure it’s confirmed.
Try BlackBoxStocks.com and get 20% off First month!
LARGE view: https://www.tradingview.com/x/dC2SAY9Q/
Well that news was broken quickly. However all is not lost….
Our simple rule is we follow big whales in and we come out when they get out too. As you can see there is still OI and that may be some bag holders or a small position that our whale left. We don’t know but we know they don’t have a full position anymore.
What next?
- Cut and go
- Bag hold and hopium
I personally got out of it but again it may come back up. We don’t know that and there has been flow that came back. You can do your own technical analysis and have everyone look at it but no one will ever have it right. I got out and I don’t care what happens next but here is what I see
*NOT BUY/SELL/BAG HODLING RECOMMENDATION.
I’m just some dude on the internet telling you what he sees. I’m not saying I’m right, I can be wrong and someone will have another chart showing I’m wrong.
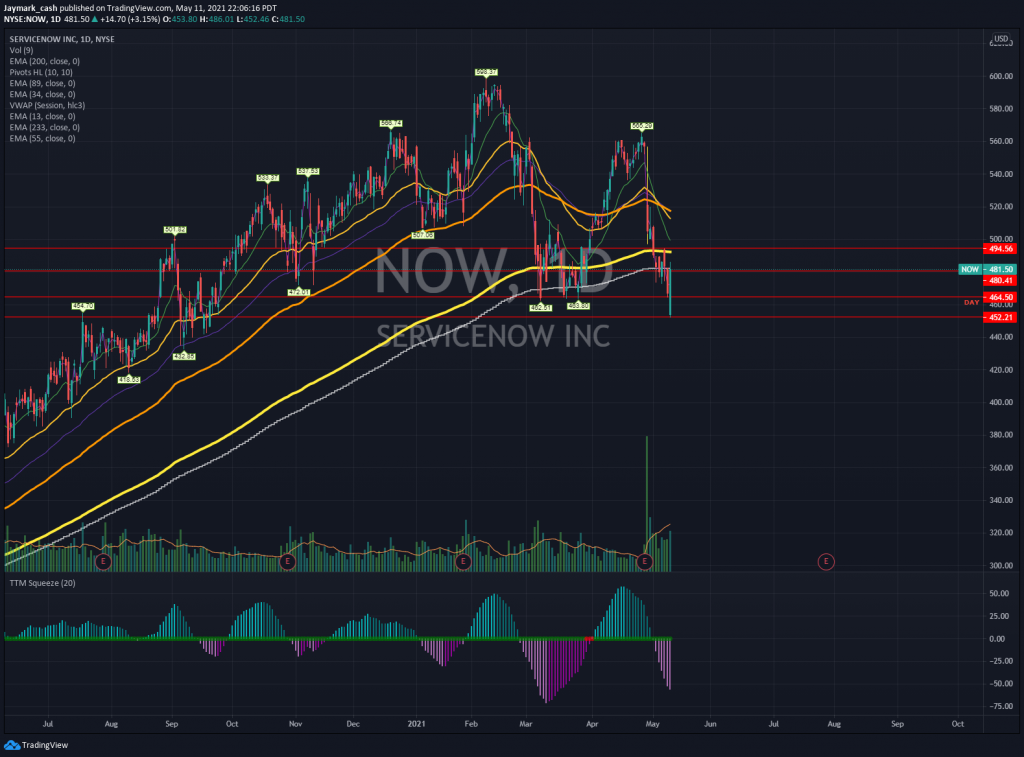
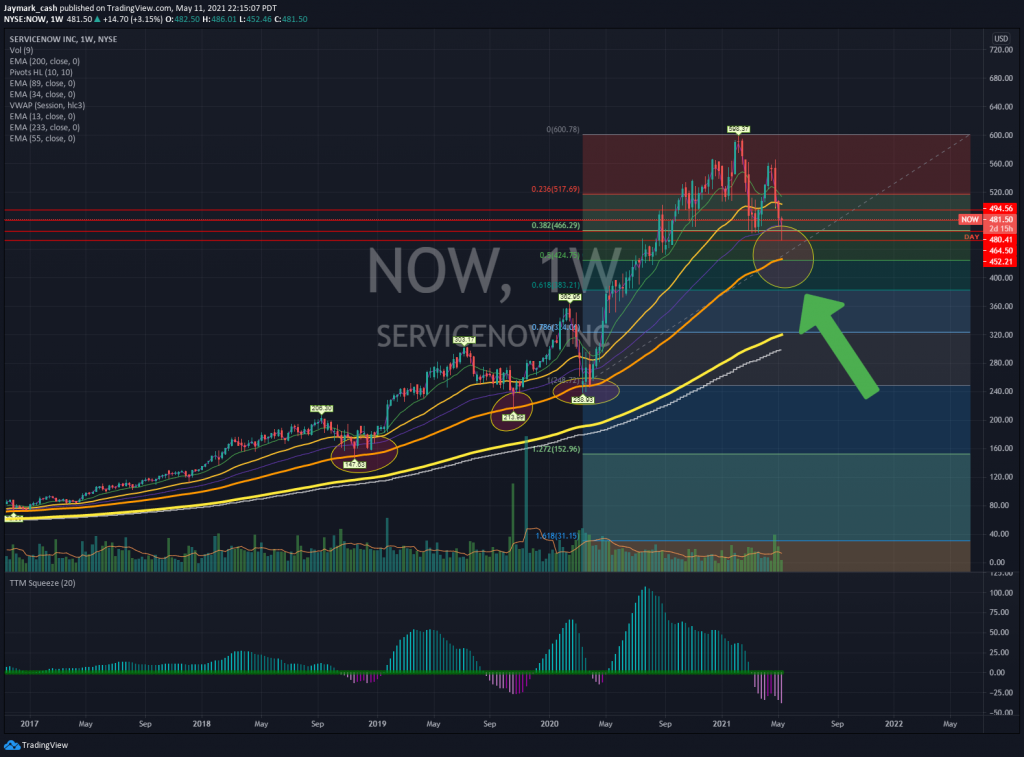
Here’s my basic TA. All the major EMAs are right on top of the current candle. It would have to break through those to get some sort of MOMO. It’s right under the 233EMA. However you might be able to scalp this on the daily. This area should have a bounce to go your way in this trade. However if it does break this take a look at the weekly
It loves to bounce off the EMA89 (orange) and has done it in the past. You want it to stay above the purple line which is the EMA 55, otherwise your contract for this play will go to ZERO.
Check your deltas to see how much you may lose per dollar. Nothing fancy here but here’s moving averages and the fib.
Otherwise thanks for reading and joining my twitter. Like and share please!
Summary for the lazy : Bought $NOW using BBS, they rolled down, they get out, now you have no idea what to do.
Excellent analysis on $NOW. TY