
How I use volume profile with blackboxstocks flow to exit trades
One thing about trading flow is when big money play, you don’t have any idea why they got in that specific area. Which means that you also don’t know where to put your stops and your exits. What you can do is guess what their intent was with the chart. An indicator that I regularly use is the volume profile.
*I’m not showing off “gains” . The following examples are just to show the potential. The only thing on the charts in the following will be the use of the volume profiles
From investopedia, this is also called “Price by Volume Chart”
- Price by volume charts are used to illustrate high buying and selling interest at specific price levels.
- They are indicative of price levels over a certain period of time.
- They are generally used in conjunction with other forms of technical analysis.
Now what the heck does that mean and how can we use it?
–>Let’s use an EXTREME example of a gap
When an area has no volume such as a “gap” , price could move one way or the other. As a side note when stocks is approaching a gap either up or down it will “stop” right before it as a major point of interest. Gaps have NO SUPPORT or RESISTANCE. It’s a gap!! No mans land.
–> Most gaps fill but it may also reverse and bounce. NEVER expect a gap to fill
Take AMD for example.

You can easily see where you can short or go long. Your support lines is also confluence with the volume profile….well duh!!
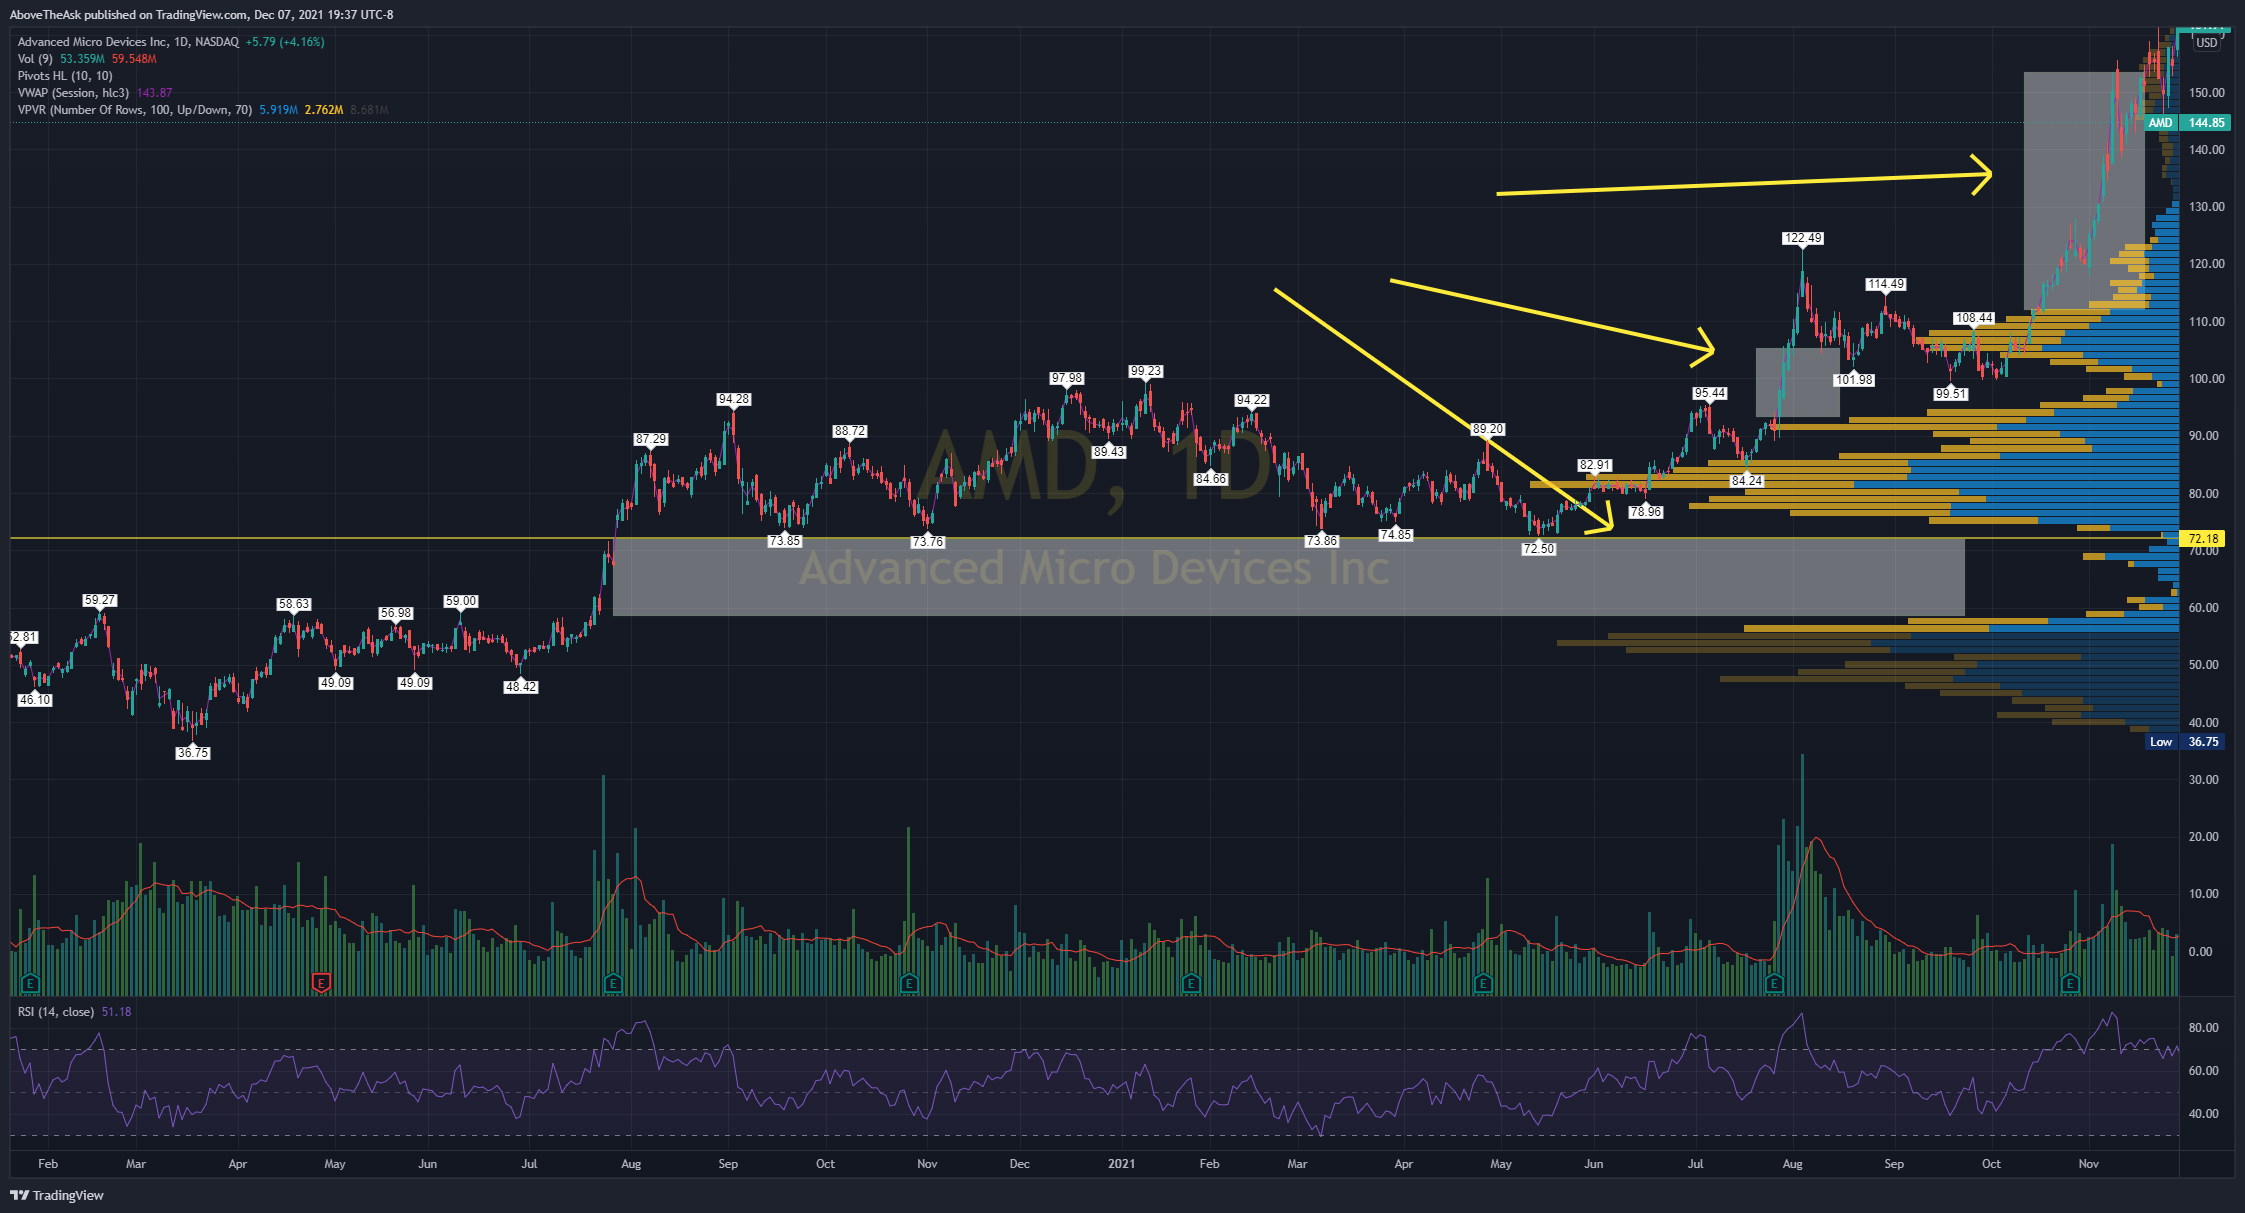
When we insert the volume chart you can clearly see that the “empty” area barley has any support or resistance in some parts You can see when those areas are hit, they have larger moves. See the candle sizes, they go crazy when there’s little volume.
Get the basic idea? The area with volume is “consolidating” aka accumulation phase. That’s all you need to know. When you’re inside of high areas of volume nodes you can see that it can get very choppy which is bad for option premium. You’ll end up burning theta. If you play commons and have weeks/months/years to hold, this wouldn’t such a bad idea but you’ll get stuck.
How do we use this to exit trades?
Here’s 5 examples that I played and showed on twitter.
The first one is $COUP earlier this year they bought it at the last candle on the right.
2 things:
- Left side notice the huge volume shelf on the left side. This is an area where there’s a ton of volume consolidating. You can see a small range of candles.
- The whale wanted to buy at that candle for whatever reason so we follow . I personally wouldn’t buy there until it breaks above the volume node but what do I know? They dropped $1M in there.

When it broke out look at what happened………..
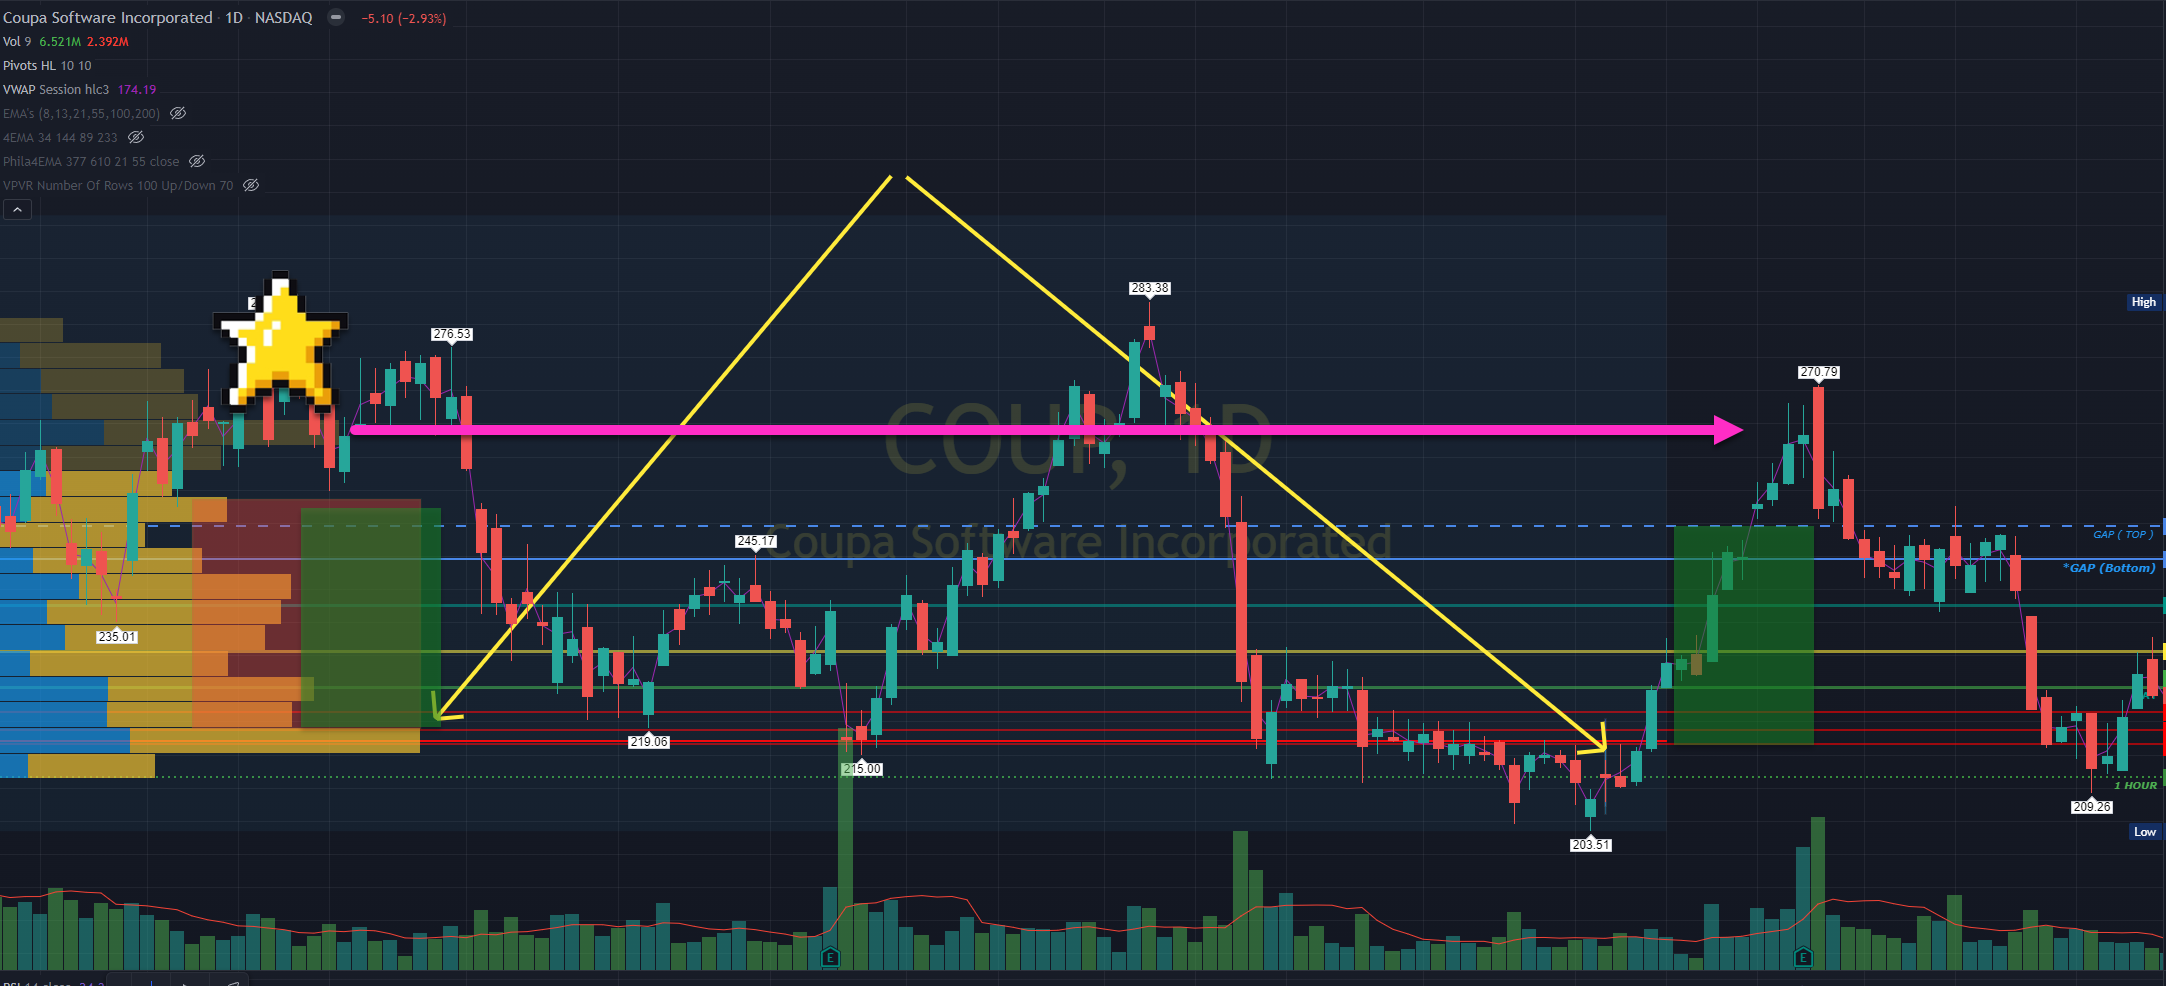
Take a look at the volume nodes (GREEN box) on the left side. It’s less than the “base” and since there was lower volume above, it was able to run up. This is where you can enter because once volume dries up and hits another volume node it may reject. In this case, it rejected at another larger volume node (pink arrow right).
2) $BURL
$BURL – Almost 100% or +$1500/contract. Still riding with these. #blackboxstocks https://t.co/uwC4gwchsn pic.twitter.com/IUHSQ2E3Lc
— AboveTheAsk _JayM (@abovetheask) November 4, 2021

You see the entry at the volume node base? There was an empty space for it to run up. However BURL eventually did reject when it hit another area with volume. See the last huge red candle? It didn’t like the price up there. Why did we get a huge red candle? It was a mix of an “descending volume node and a bad market.
BUT if market was participating, you see how if it broke above the resistance, it could have ran even further.
3) $ZEN
$ZEN -🎯 Targets Hit. I'm all out +150%. $2.92 to $7.48.
👉You guys see what happens when you "move your stops"
⭐️Make a plan⭐️
Where does it show you need to sell?
If it reversed you'd get stopped out#blackboxstocks https://t.co/fPb3hrKQv5 pic.twitter.com/jLmuoOTZfi
— AboveTheAsk _JayM (@abovetheask) October 21, 2021

The entry gave us a drawdown because it rejected that price on that day. But it found support in a moving average (not adding on chart due to this lesson). It created a pennant days later and eventually broke out. Once it broke out, there was room to run due to the low volume shelf. Once again it tried to keep running but eventually market and overbought conditions occurred (highs in green)
4) $DPZ
$DPZ I'm all out of my complete position +130%
🍕🍕$24.81 to $57.40
Still has room to go but rather not hold any longer. We'll get some more flow in #blackboxstocks https://t.co/AJ5CGmOEPo pic.twitter.com/avUxl8Owcr
— AboveTheAsk _JayM (@abovetheask) November 12, 2021

DPZ was a huge run up. Again we see it with that volume node. Pay attention to the last green candle on 12/7.
5) $VFC
$VFC – Got out barley 🥬$2.45. ER is Friday morning and rather not risk having this go red with only today/tomorrow to run up. Do not want to play ER due to risking IV crush. #blackboxstocks https://t.co/7s00vf5oIt
— AboveTheAsk _JayM (@abovetheask) October 20, 2021

VFC did one did NOT make it to the bottom of the next volume node. There was some resistance and it was close to ER. The best thing to do is just to get out.
The risk/reward was not worth it due to ER being so close.
Summary :
These work both ways, they can help calls and puts. You can use this to supplement your charting. When there’s a huge volume area you need to make sure that you put your lines there. It will help guide the trade which ever direction. It will always be confluence with S/R levels. I also use moving averages but we will leave that out in this lesson because it will be confusing.
Just keep a note about these areas specially when playing flow.