Example of why letting the chart show your exit $COUP
Coup is a perfect example of why you can let TA give you the exit. There was a lot of us that played it and made some decent money. Remember because a stock is trending up and it’s “too high” doesn’t mean it needs to “come down”. Specially if the market is participating, you’d get wrecked if you tried to short.
The stock market does what is wants.
Everything I’m about to show you can fail and will fail in the future.
But what is fact is letting the chart tell you when to exit and enter.
There’s numerous strategies that people use but I personally use EMA / SMA to help guide me. This is what has been working for me and I love using it.
FLOW of $COUP

All our check boxes are marked. Would you dump your whole account here? NO. Would you add more than usual? Yes BUT if within your risk tolerance. Will the next $1M one make the COUP gain? Hell no. Just saying be very careful in playing flow.
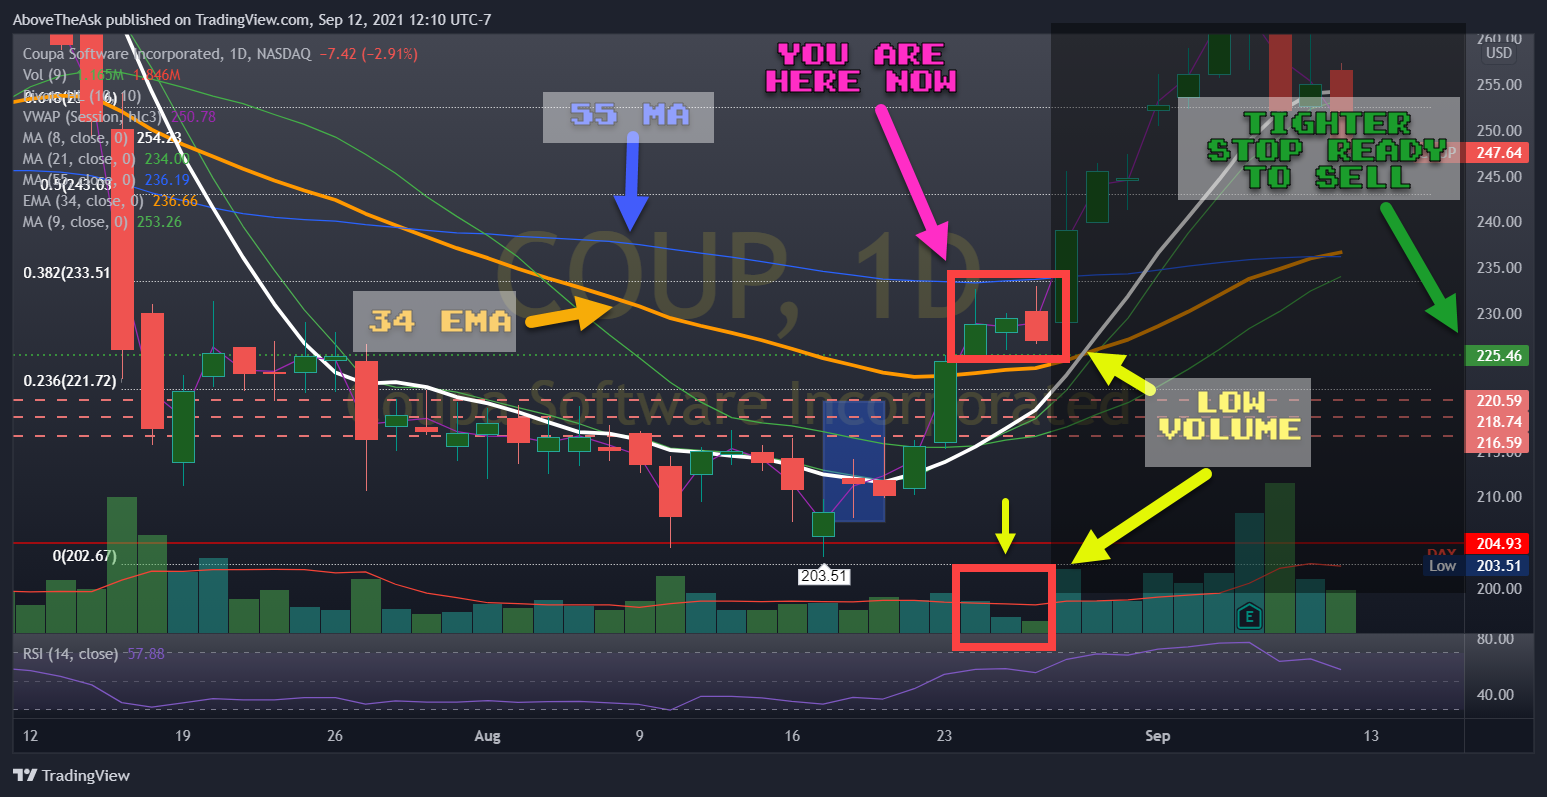
Overall basic chart of COUP at the time
- Trying to close above 610 EMA (yes 610)
- RSI – This has been selling off so you’re in oversold territory
- Previous support is still holding since MAY 2020
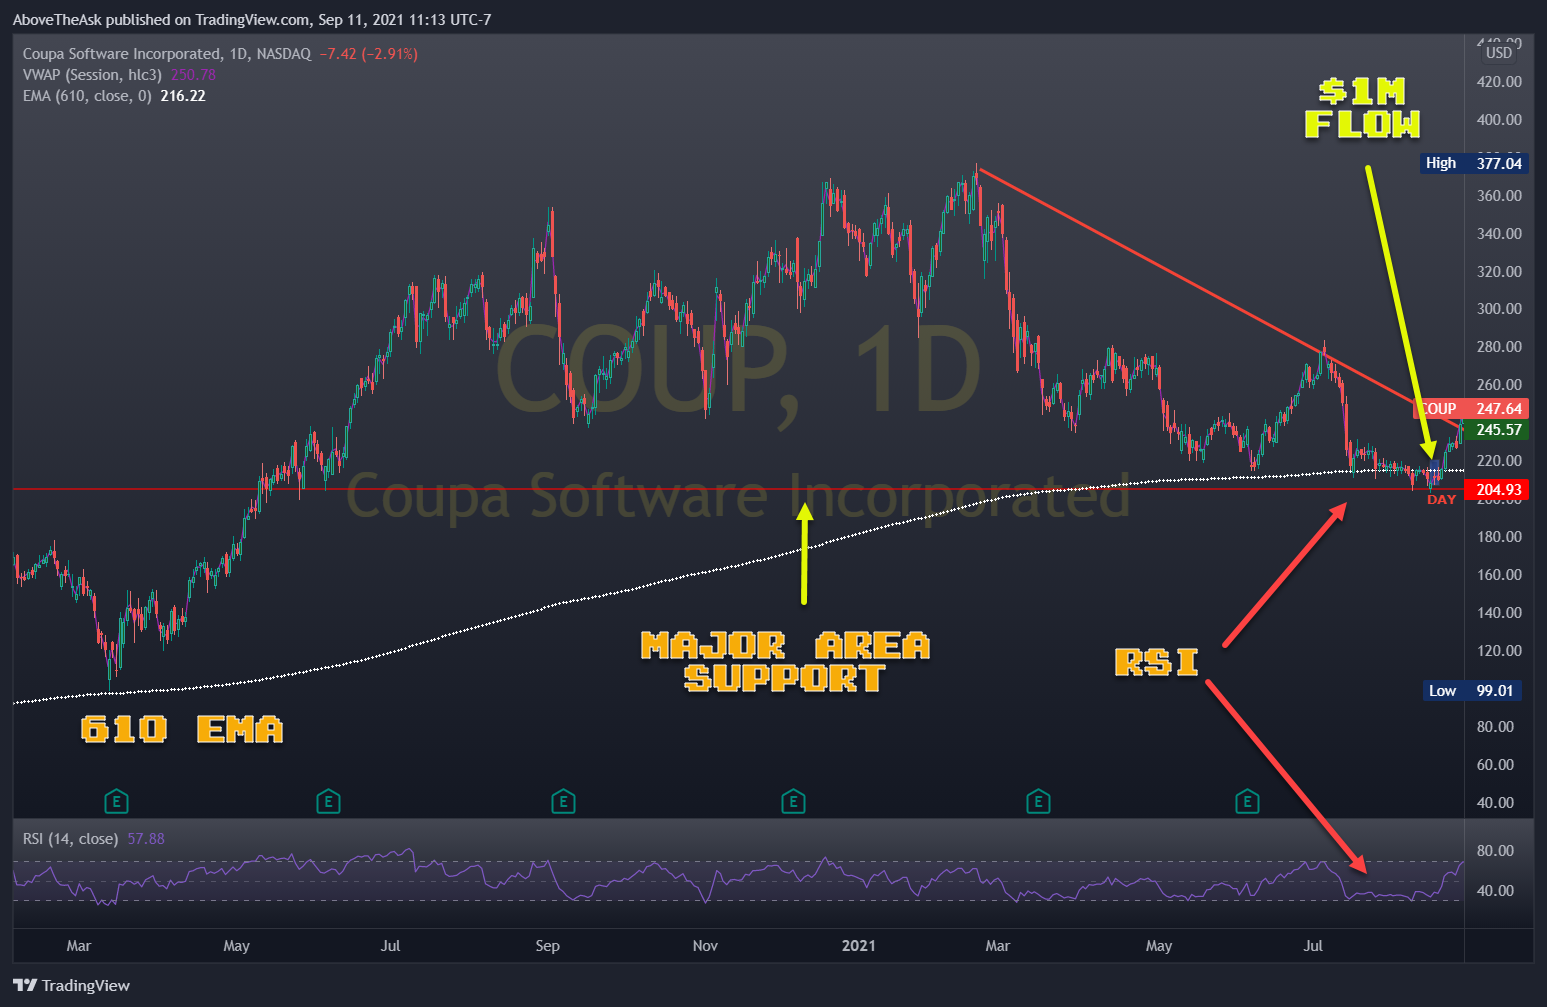
The conditions above has great confluence on the trade specially when somebody drops $1M in that options call.
This is where you had a ton of choices and depending on the amount of positions you. It is a pricey one for smaller accounts so I do understand if you only chose one. But this strategy works for any contract price.
Let’s talk about the huge green candle.
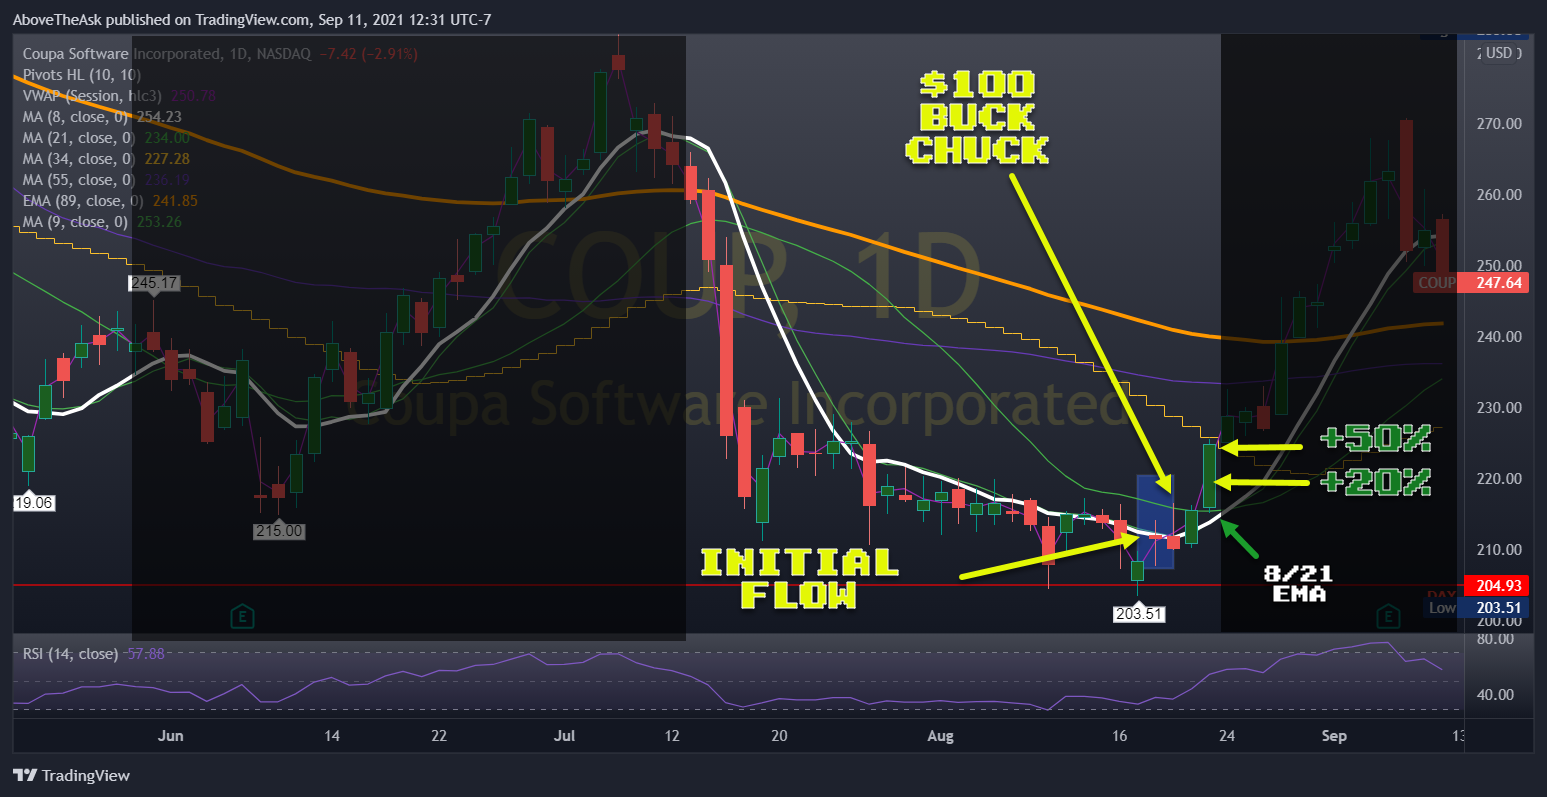
Selling decisions:
- $100 Buck Chuck (easy money)
- Sell during that huge candle somewhere between 10% to 50% gains (appox HOD)
Overall holding for 3 days to make 20%-50% is GOOD. You should have NO regrets selling it early
If you look to the left, it stopped at previous resistance AND came within the 34 SMA (ORANGE) and stopped out.
Hitting it’s head on a ceiling
However end of that day you can also see that it held previous day’s resistance and became support. It also closed above the 8EMA and 21EMA
RISKS:
- Stay rejected below the 34SMA
- Gap down due to market conditions
- Consolidate in that range and fail
- Re-test of previous day highs.
Stop loss (if holding that day):
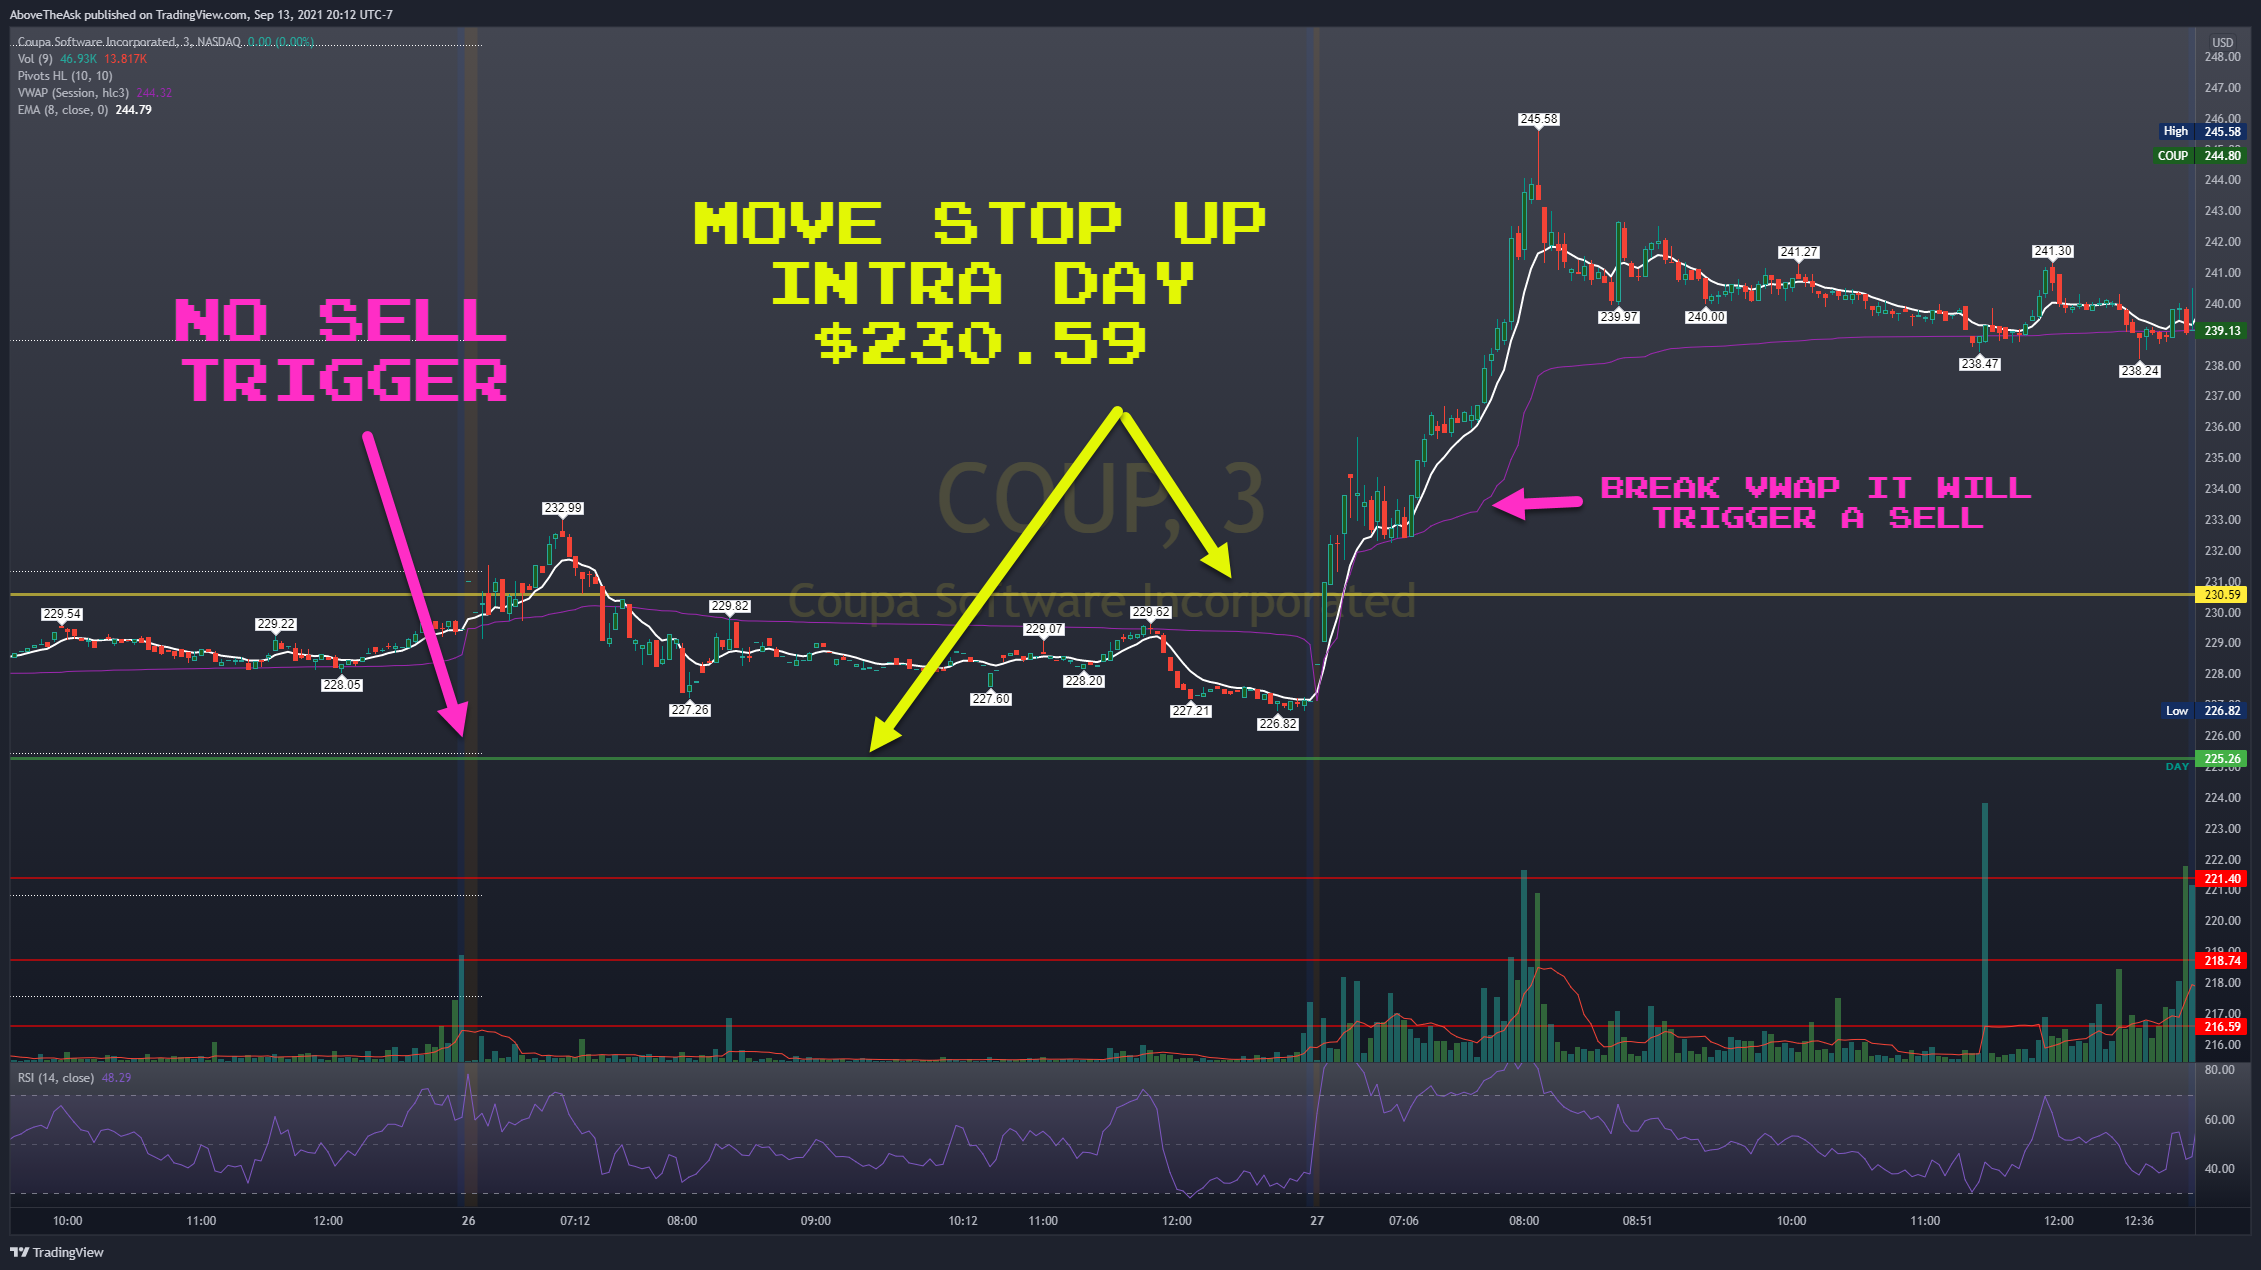
Mentally you could have seen the chart on the hourly or which ever you prefer.
The higher the stop loss the more likely it will sell
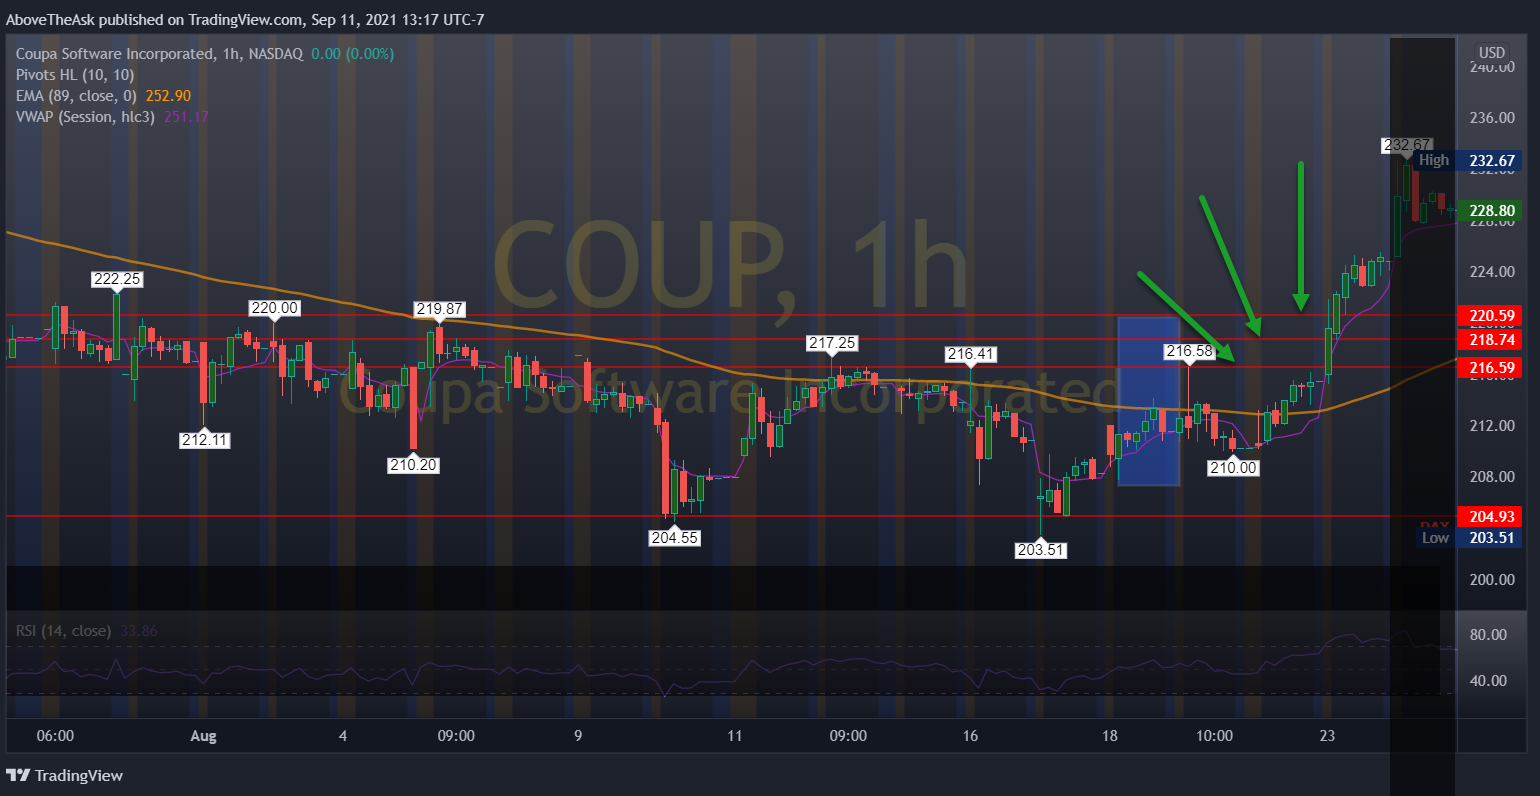
These numbers 216.59 / 218.74 / 220.59 are just based on the previous candlesticks. in a shorter time frame. If you had 1 contract and still wanted to feel a bit greedy, you could have put your stop loss at 216.59 to keep some gains OR you could have did it at breakeven and call it a day.
*These areas in a small time frame can also be used as selling points
NEXT candles
Let’s say you took the $220.59 as a tighter stop on that day of the SPIKE. The next day (first green candle in box) , if it opens lower you’ll get stopped out or if it dips and rips you may also get stopped out. But that’s the risk you’re taking. That would have been +50% gains.
1st Candle (8/24)
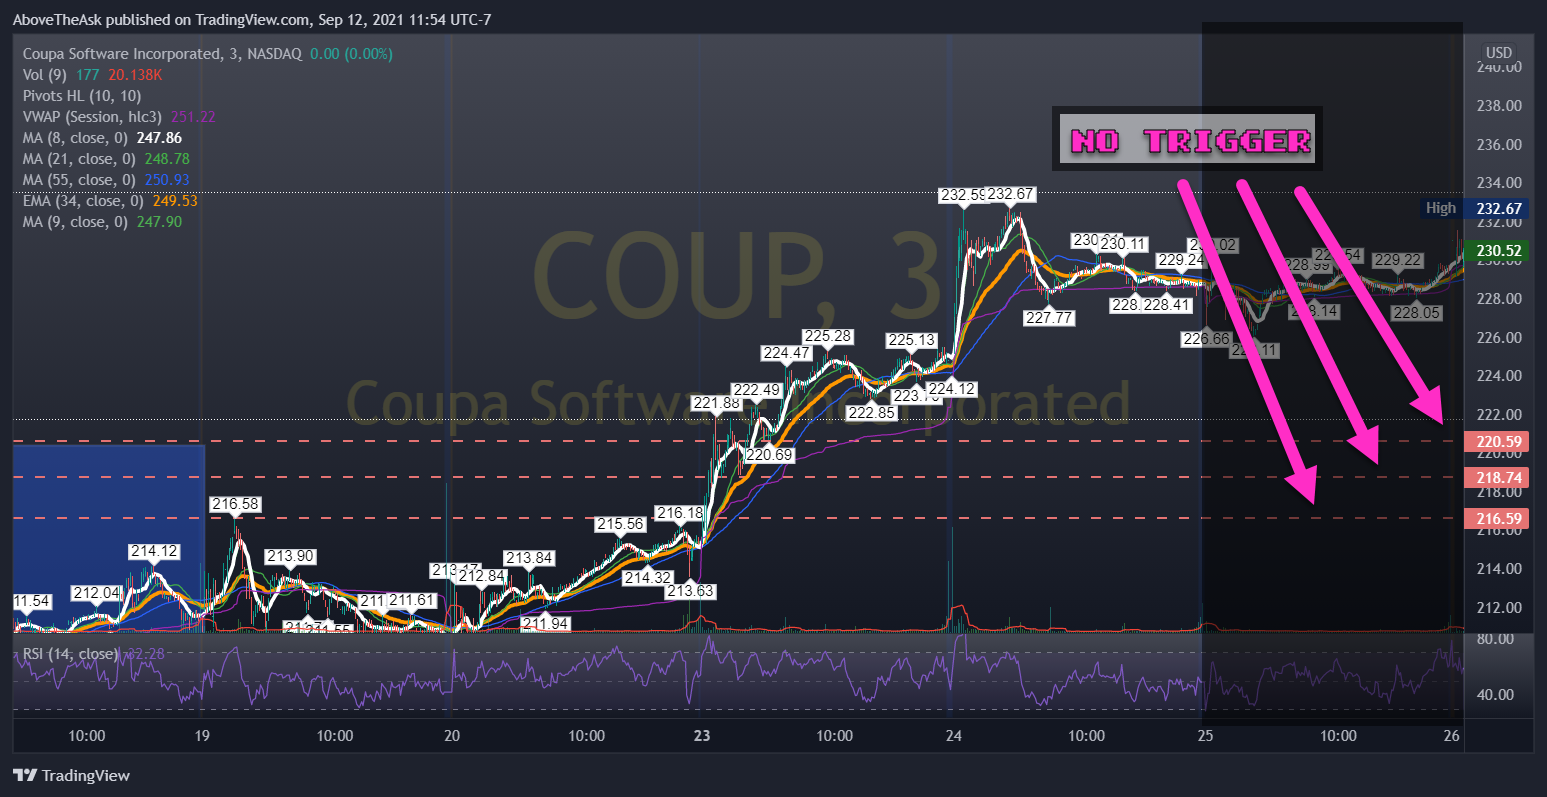
2ND Candle (8/25)
Depending on how much longer you want to hold this option you have 3 choices
- Move up the stop to trigger it closer (remember this expires 9/17)
- Take all gains
- Let it ride more which means you can put a stop around $225- $225.46. If you want out quicker you can do previous day lows.
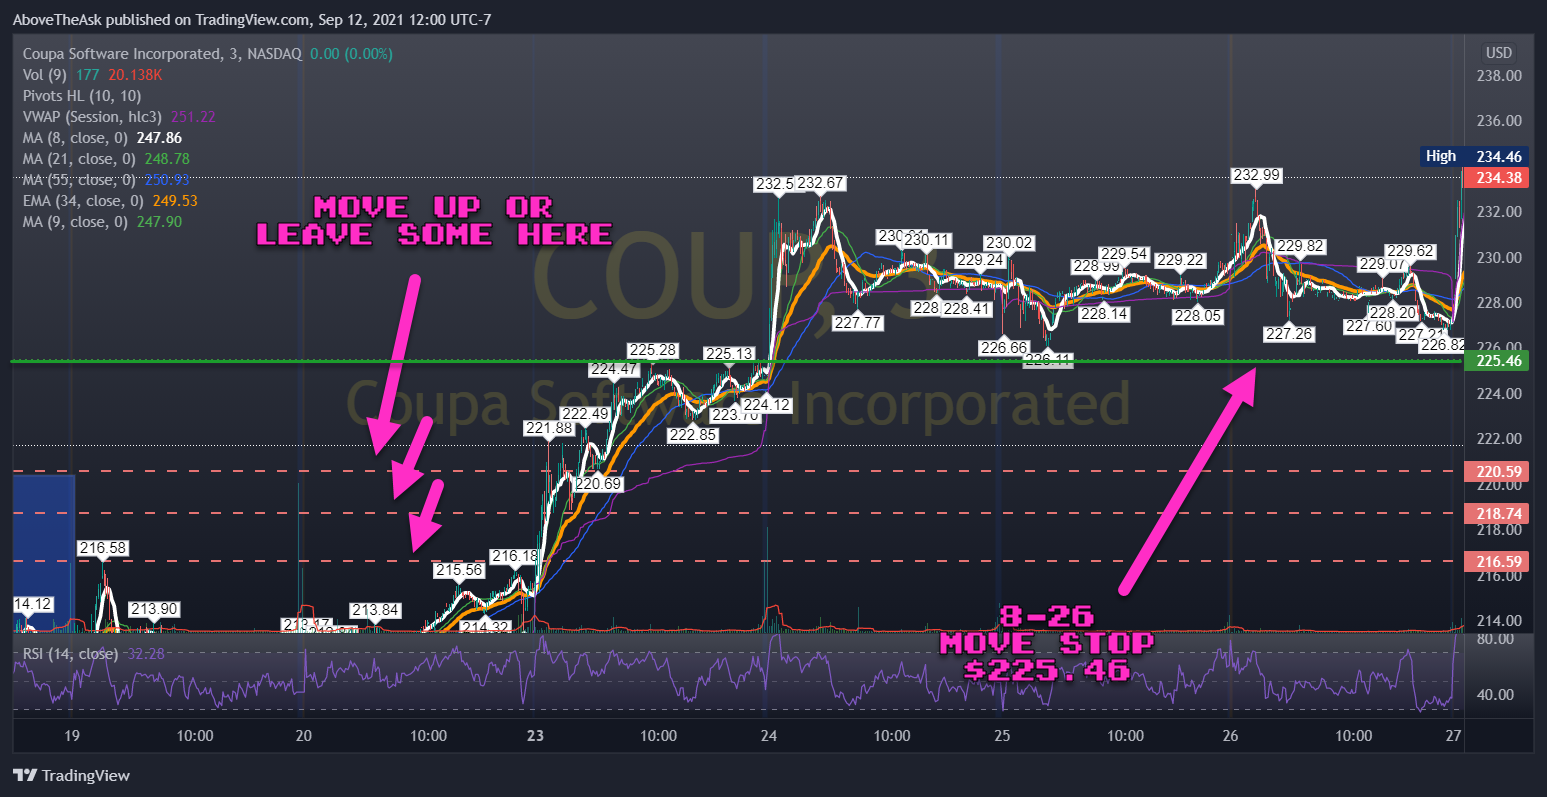
3rd Candle (8/26)
In summary here is what you did.
I really like this one pay attention. First of all, for 3 days in a row you see that it’s above the 34 EMA. It is also closing higher which is a good sign. The 55SMA has been a challenge since it keeps trying to break above but getting stuck. However it is above the 34 EMA.
From this point, it can consolidate or breakdown which will result in your stop loss getting triggered. Even one day in the market can cause this to pull back.
For the following descriptions, this is the daily candles, the next few paragraphs will be on a smaller timeframe :
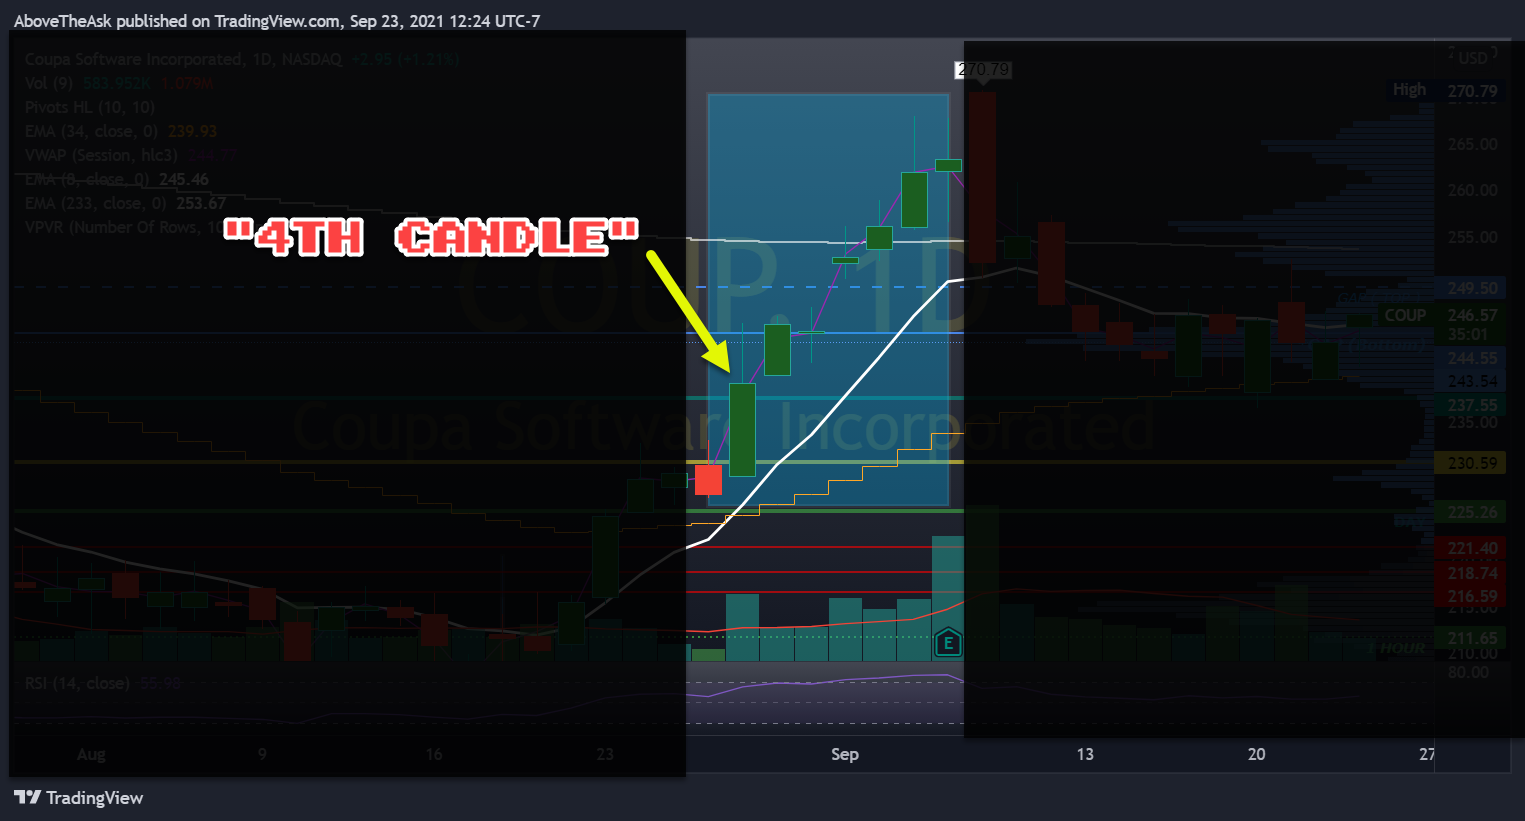
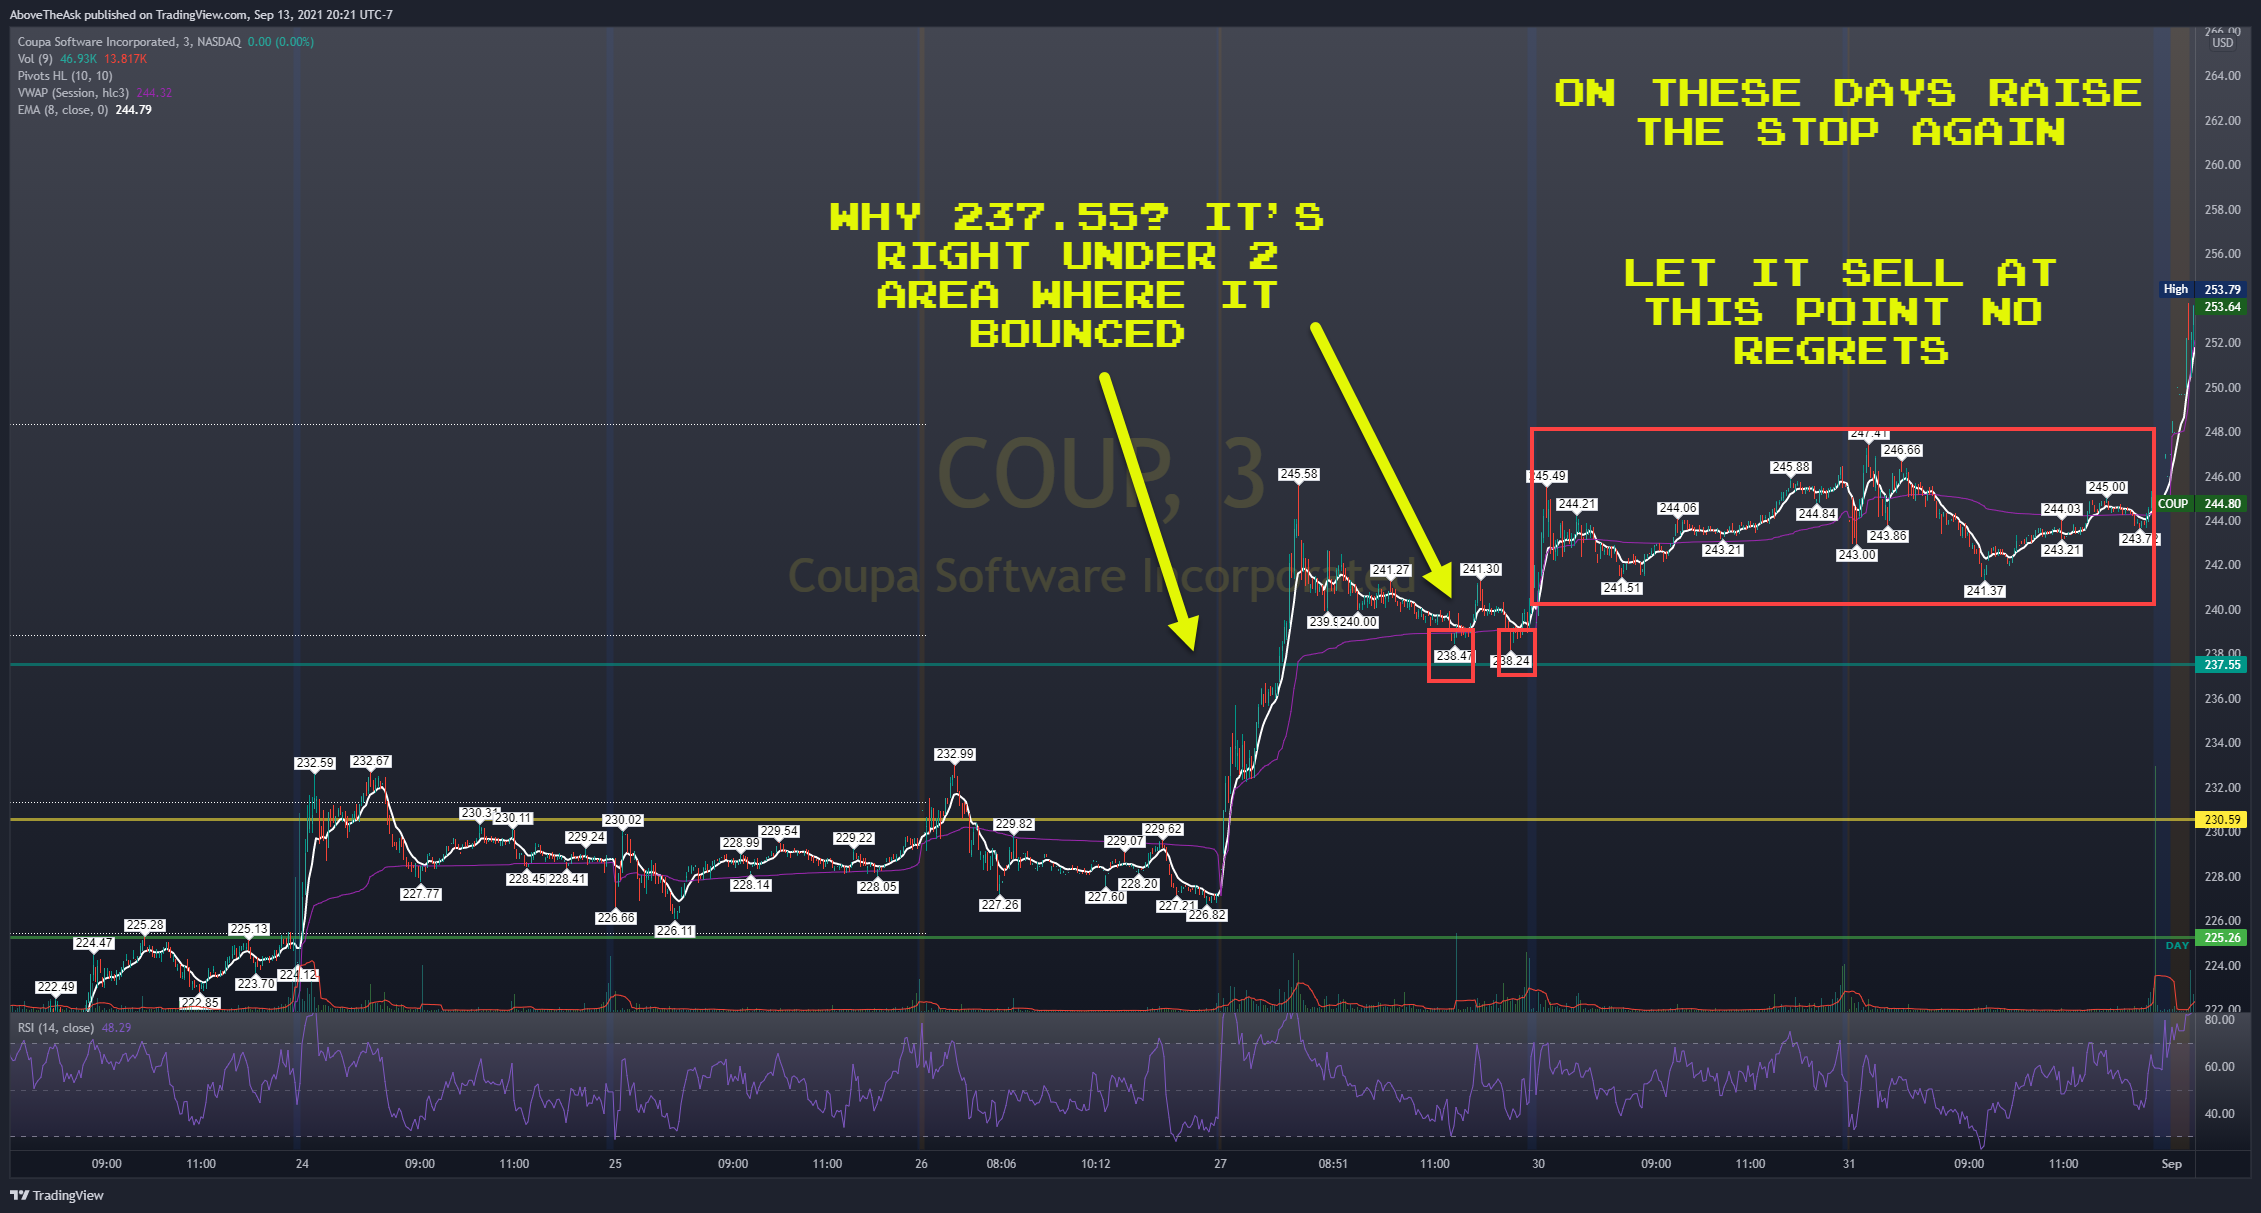
4th Candle (8/27)
If this day it opens lower, then it SELLS. However keep letting it ride. As you can see it never broke VWAP yet (purple) so move the stop while you watch price action. If it sells then it sells. You’re up well over targets now. But again. Move the stop higher so you sell. $230.59
5th/6th Candle (8/28 and 8/29)
Again I feel like I’m repeating myself but watch the chart. As you can see, move your stop AGAIN.
$237.55 and just let it sell by itself at this point.
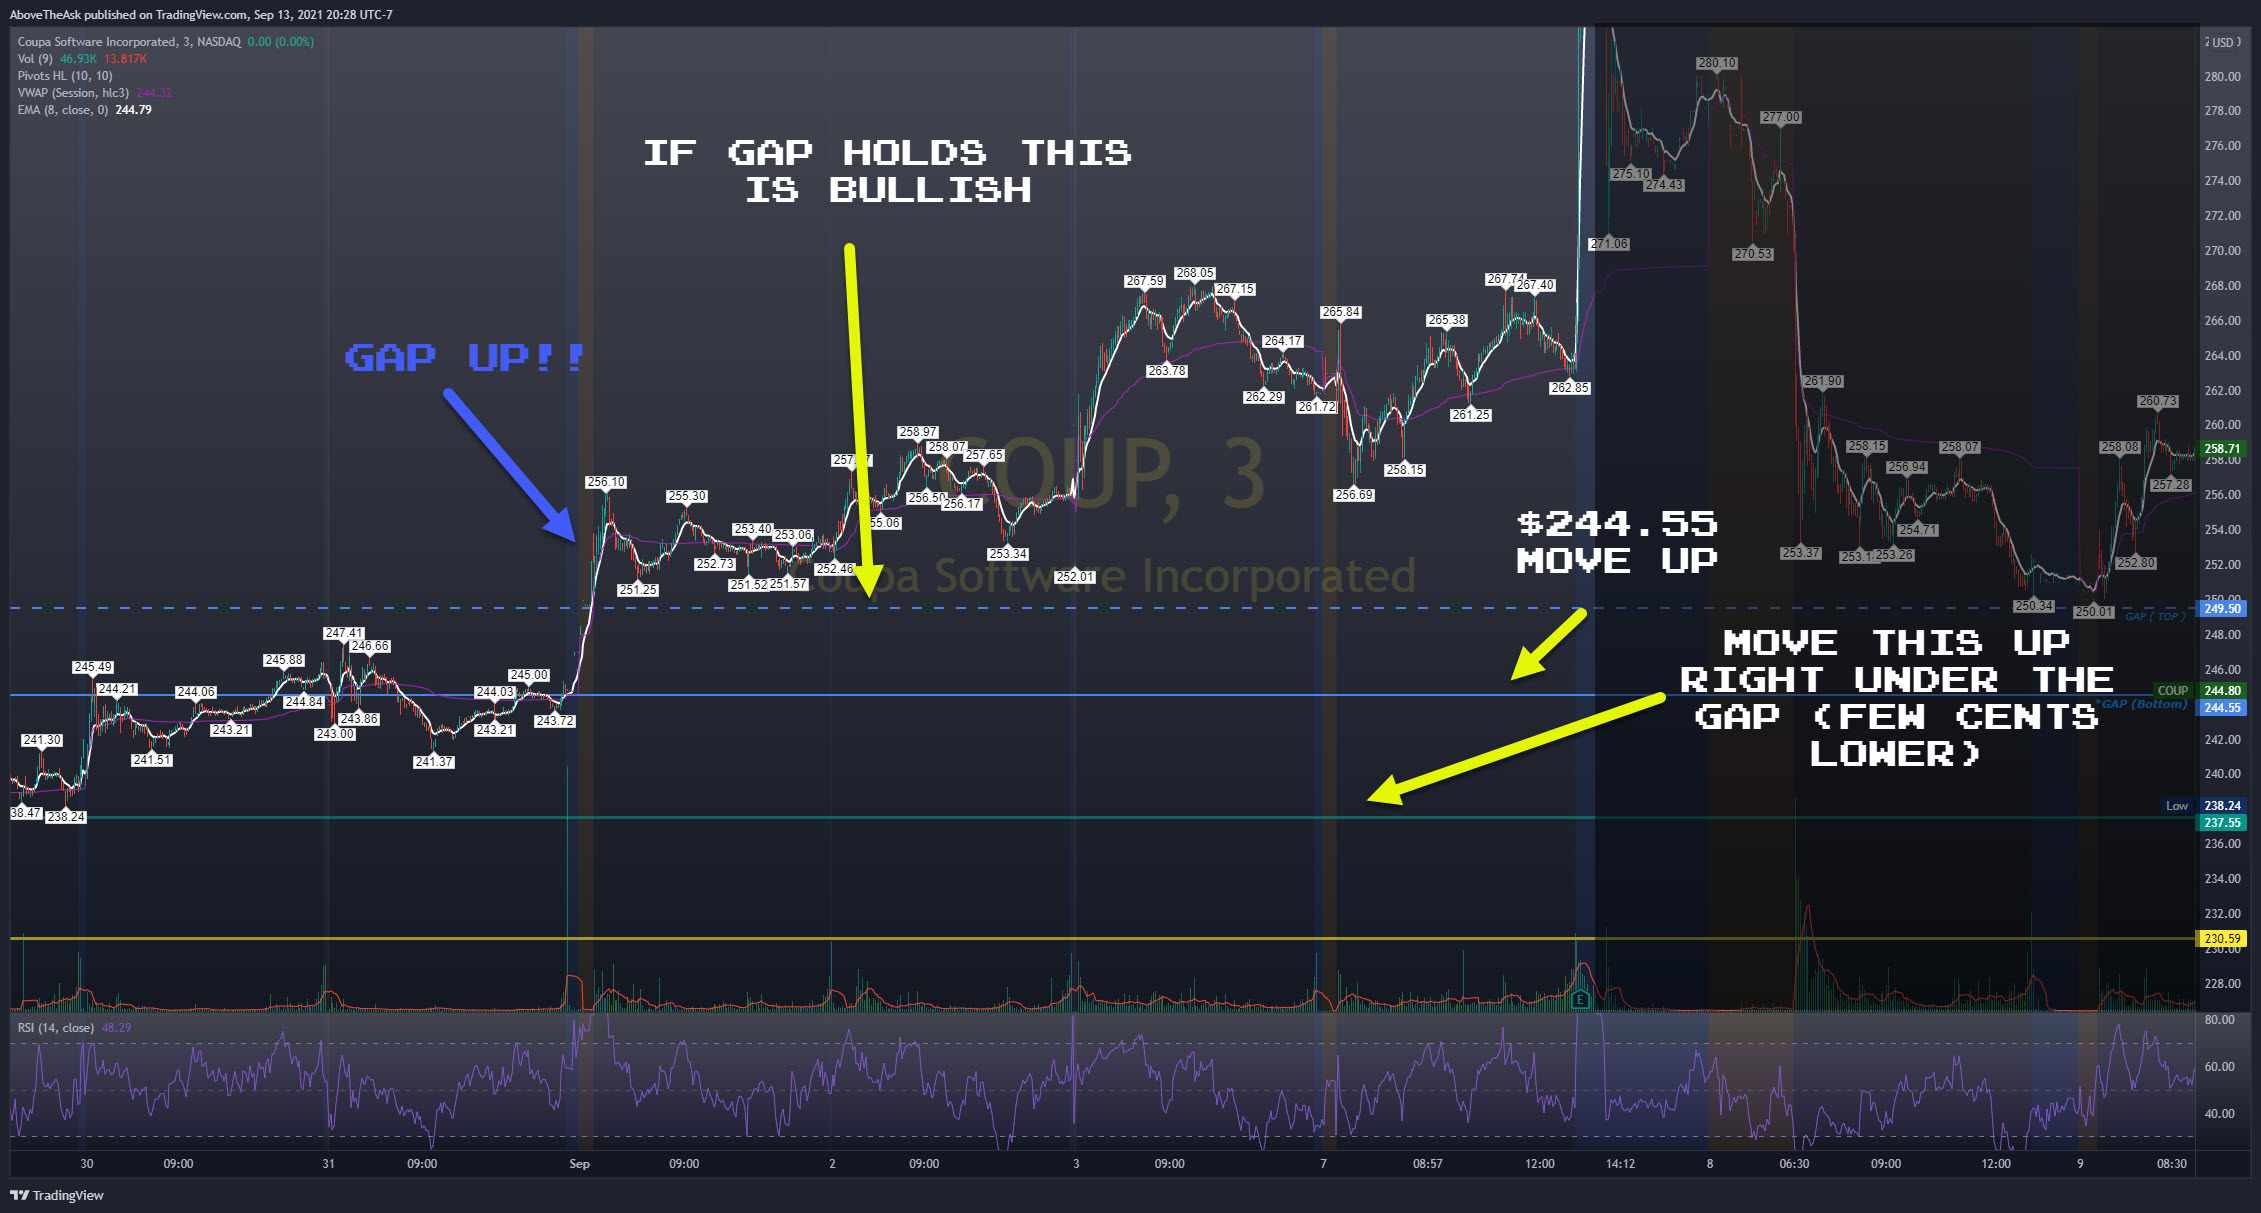
Last few candles (9/1 gap up) to ER
This gapped up to make even more gains. At this point you should have already taken gains.
A few things to note here. You’re getting very close to ER so this thing can sell off. On the day of the gap up, you could have sold or move your stop at the previous day’s close. You can choose to do a few cents lower just in case the gap fills and rips.
A gap that doesn’t fill is bullish or bearish depending on which way the gap went. In this case it never tapped the gap, therefore it’s bullish while in it’s trading session.
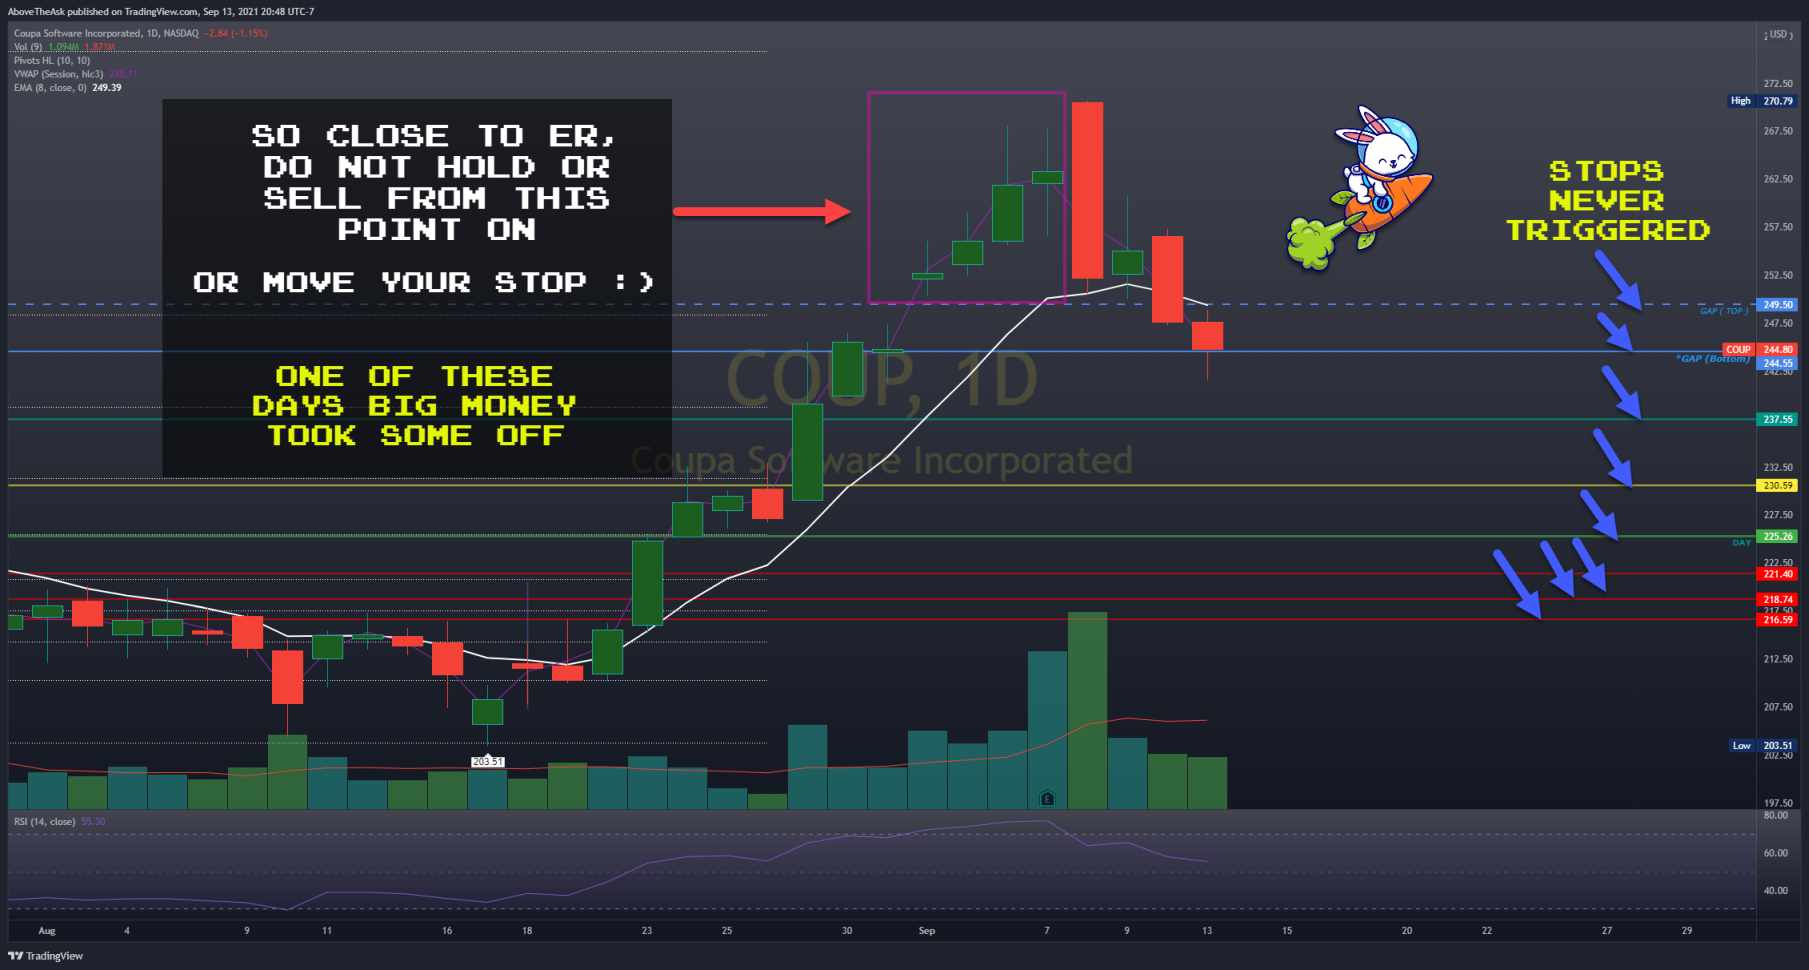
My favorite thing about this play was the date to the ER run up. It literally had an expiration date. So you already know that this will have to either get bought up or sold.
In Summary here’s the final triggers.
These were gains that you would have made if you haven’t sold. But again GREEN is always GREEN. I can never tell traders enough to always take profits but make sure on the way up you’re taking and putting spots to keep your gains.
A few disclaimers here:
- The lines you put your stop loss is up to your risk tolerance.
- Always remember that you can easily get stopped out if there’s a huge sell but quickly bounces.
- Stocks can always gap down and you’ll lose all your gains.
- Wicks can stop you out.
- Otherwise I hope this helps everyone
- Your emotion is what will hold you back
- You can’t control gap downs and this can turn RED