
Tesla falls over 10% along with the market in September
Tesla is a stock everyone watches and every little dip the bears come in try to eat the bulls alive. However I noticed no one really has a total understanding of the market itself. For most people all they see if the price goes up or it goes down without any rationality.
We also get some absurb price points from both ends from people saying TSLA is $100 stock and some just like ARKK Invest (I love you guys) says it’s a $7,000+. No one can predict and no one is right or wrong. As someone who’s buillish on TESLA here is my take.
Let’s start with the overall market.
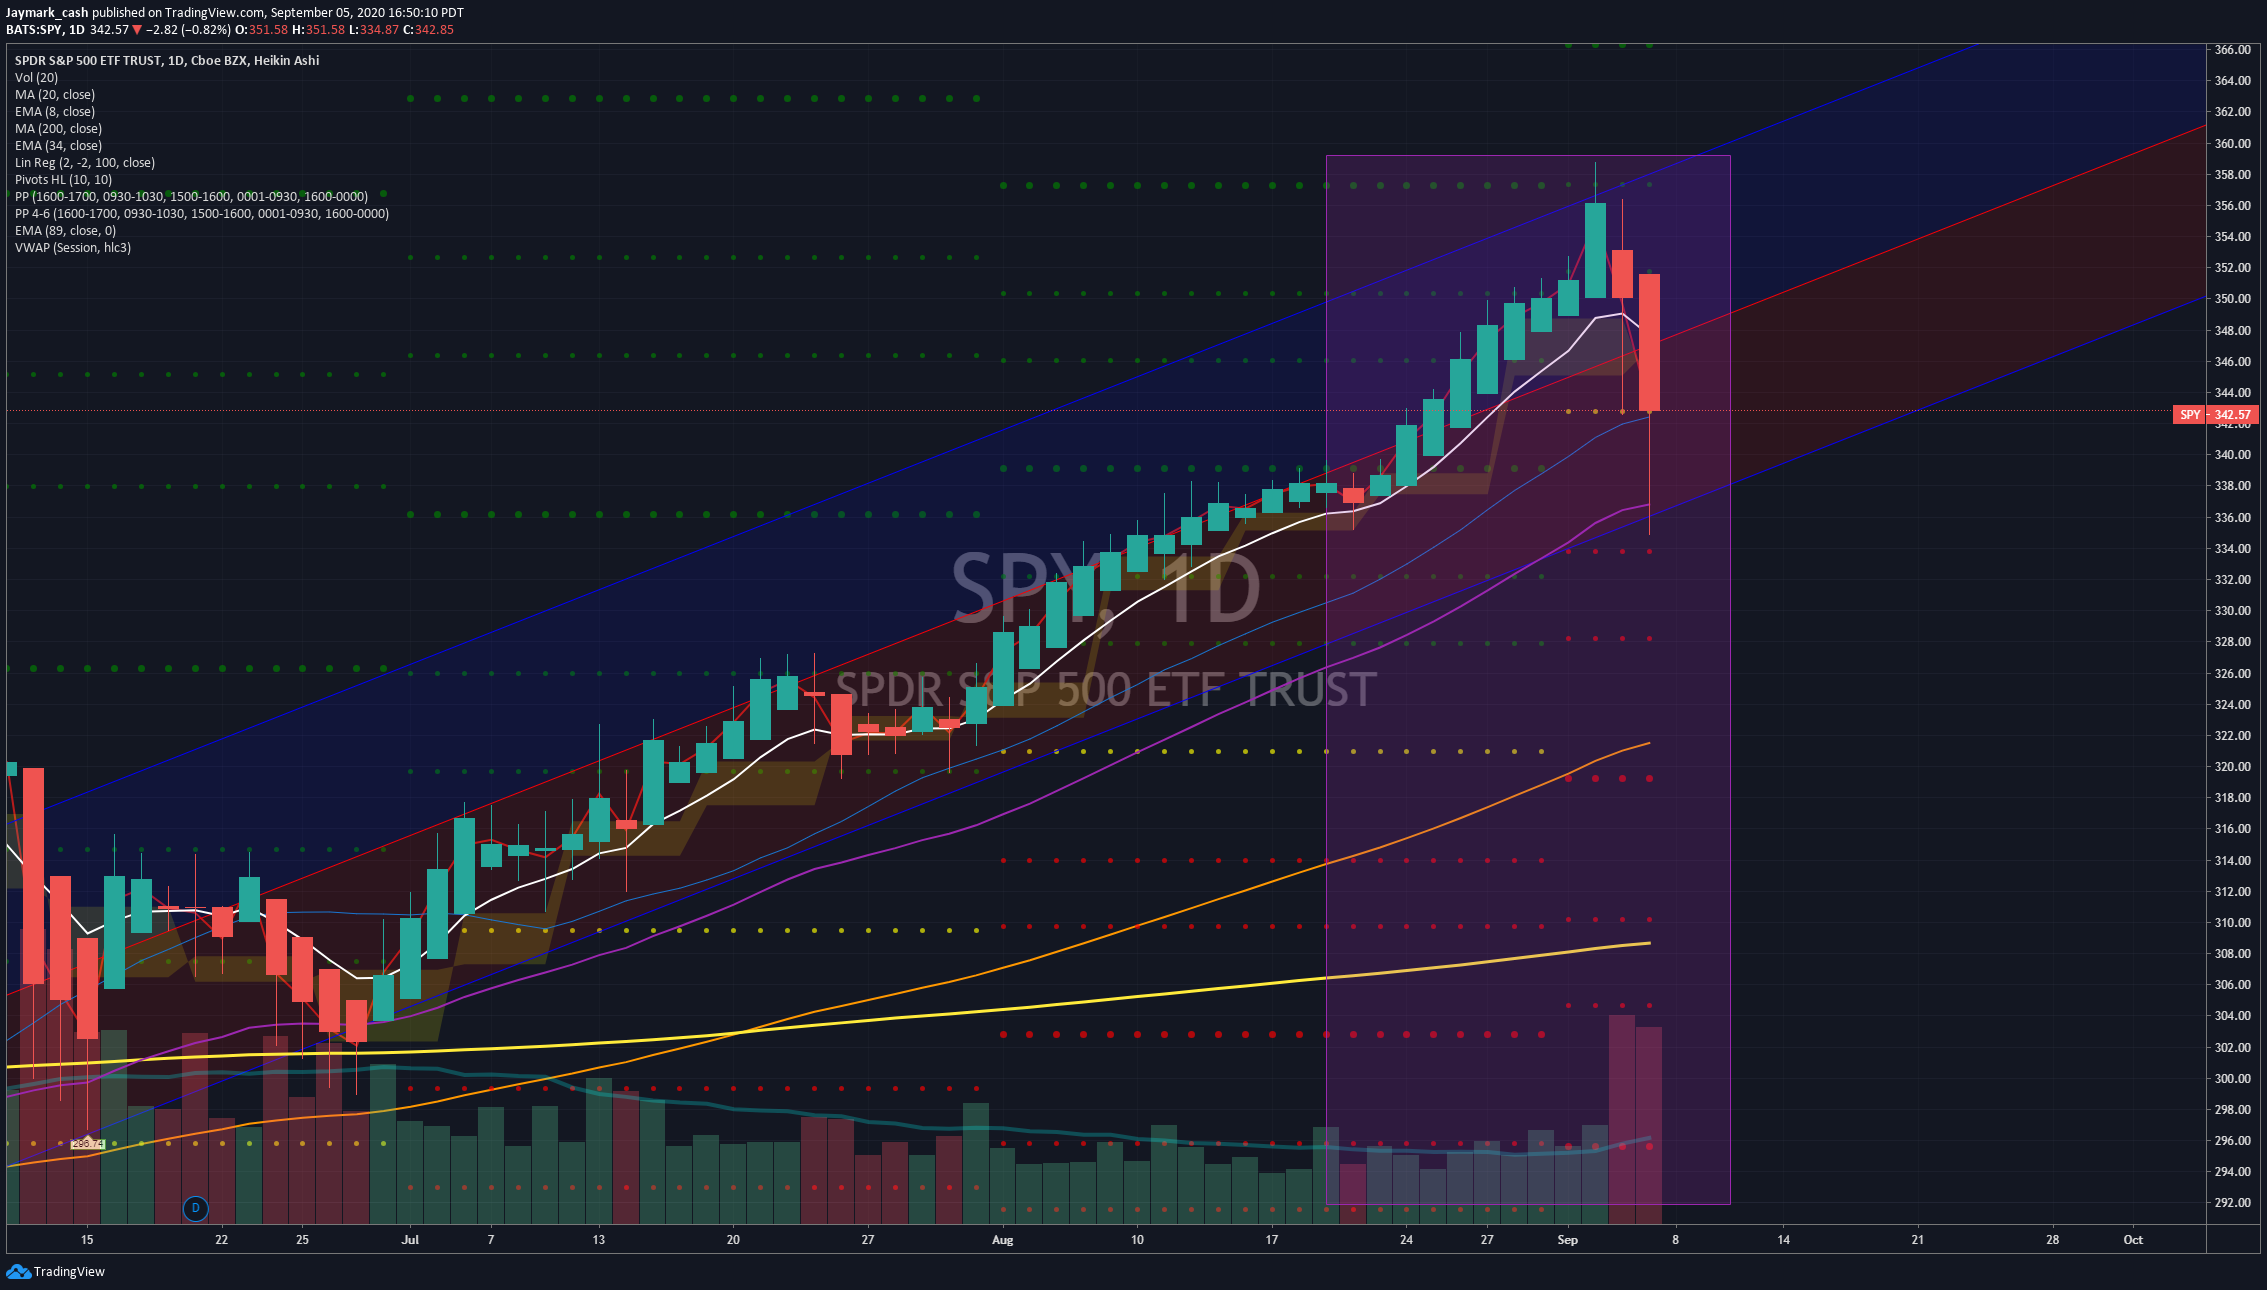
This is the S&P 500 in a 1 day chart and I highlighted from August 18 to September 4.
- The spy was on a green streak for 9 days in a row.
- It started to look overbought
- It was due to a pullback as it stayed about the 8 EMA.
- The last candle it found support at the 34EMA and closed above the 20MA.
Now let’s look at the UVXY
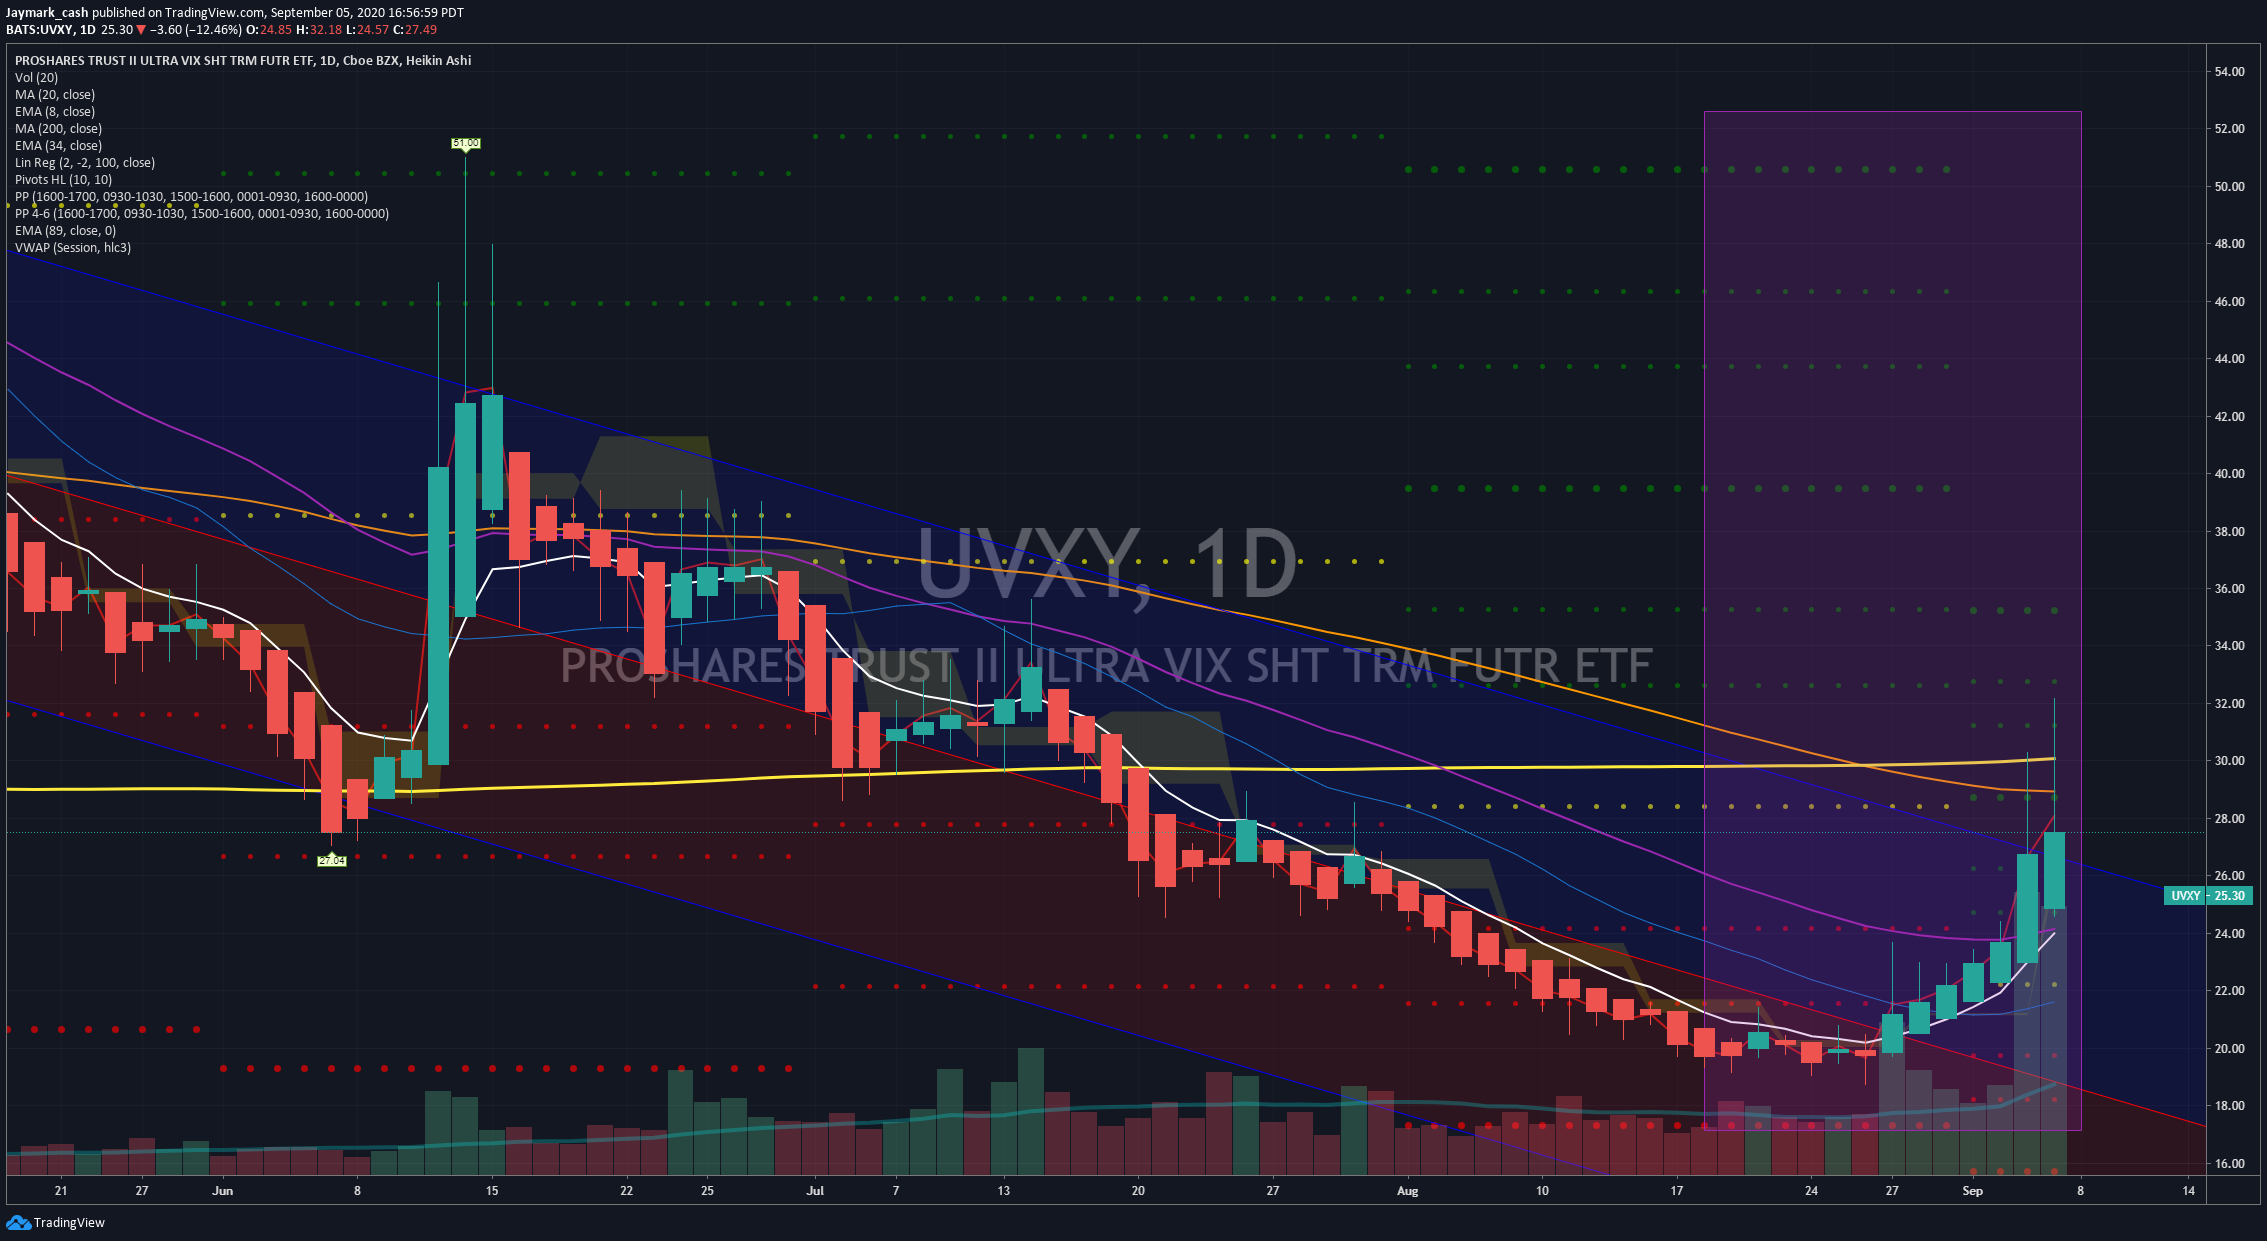
Above is the same time frame on the daily. As you can see both the UVXY and SPY are supposed to be inverse of each other but this is what happened. In the last week, both were coming up at the exact same time. You can’t have these 2 guys who are supposed to be inverse , to come up at the same time.
Eventually one of them will win and this time UVXY takes the crown. In other words it caused the market to sell off. Let’s hope UVXY doesn’t breakthrough the 200 MA (yellow)
This was just a simple market correction as tech stocks and the overall market is been going up.
TESLA
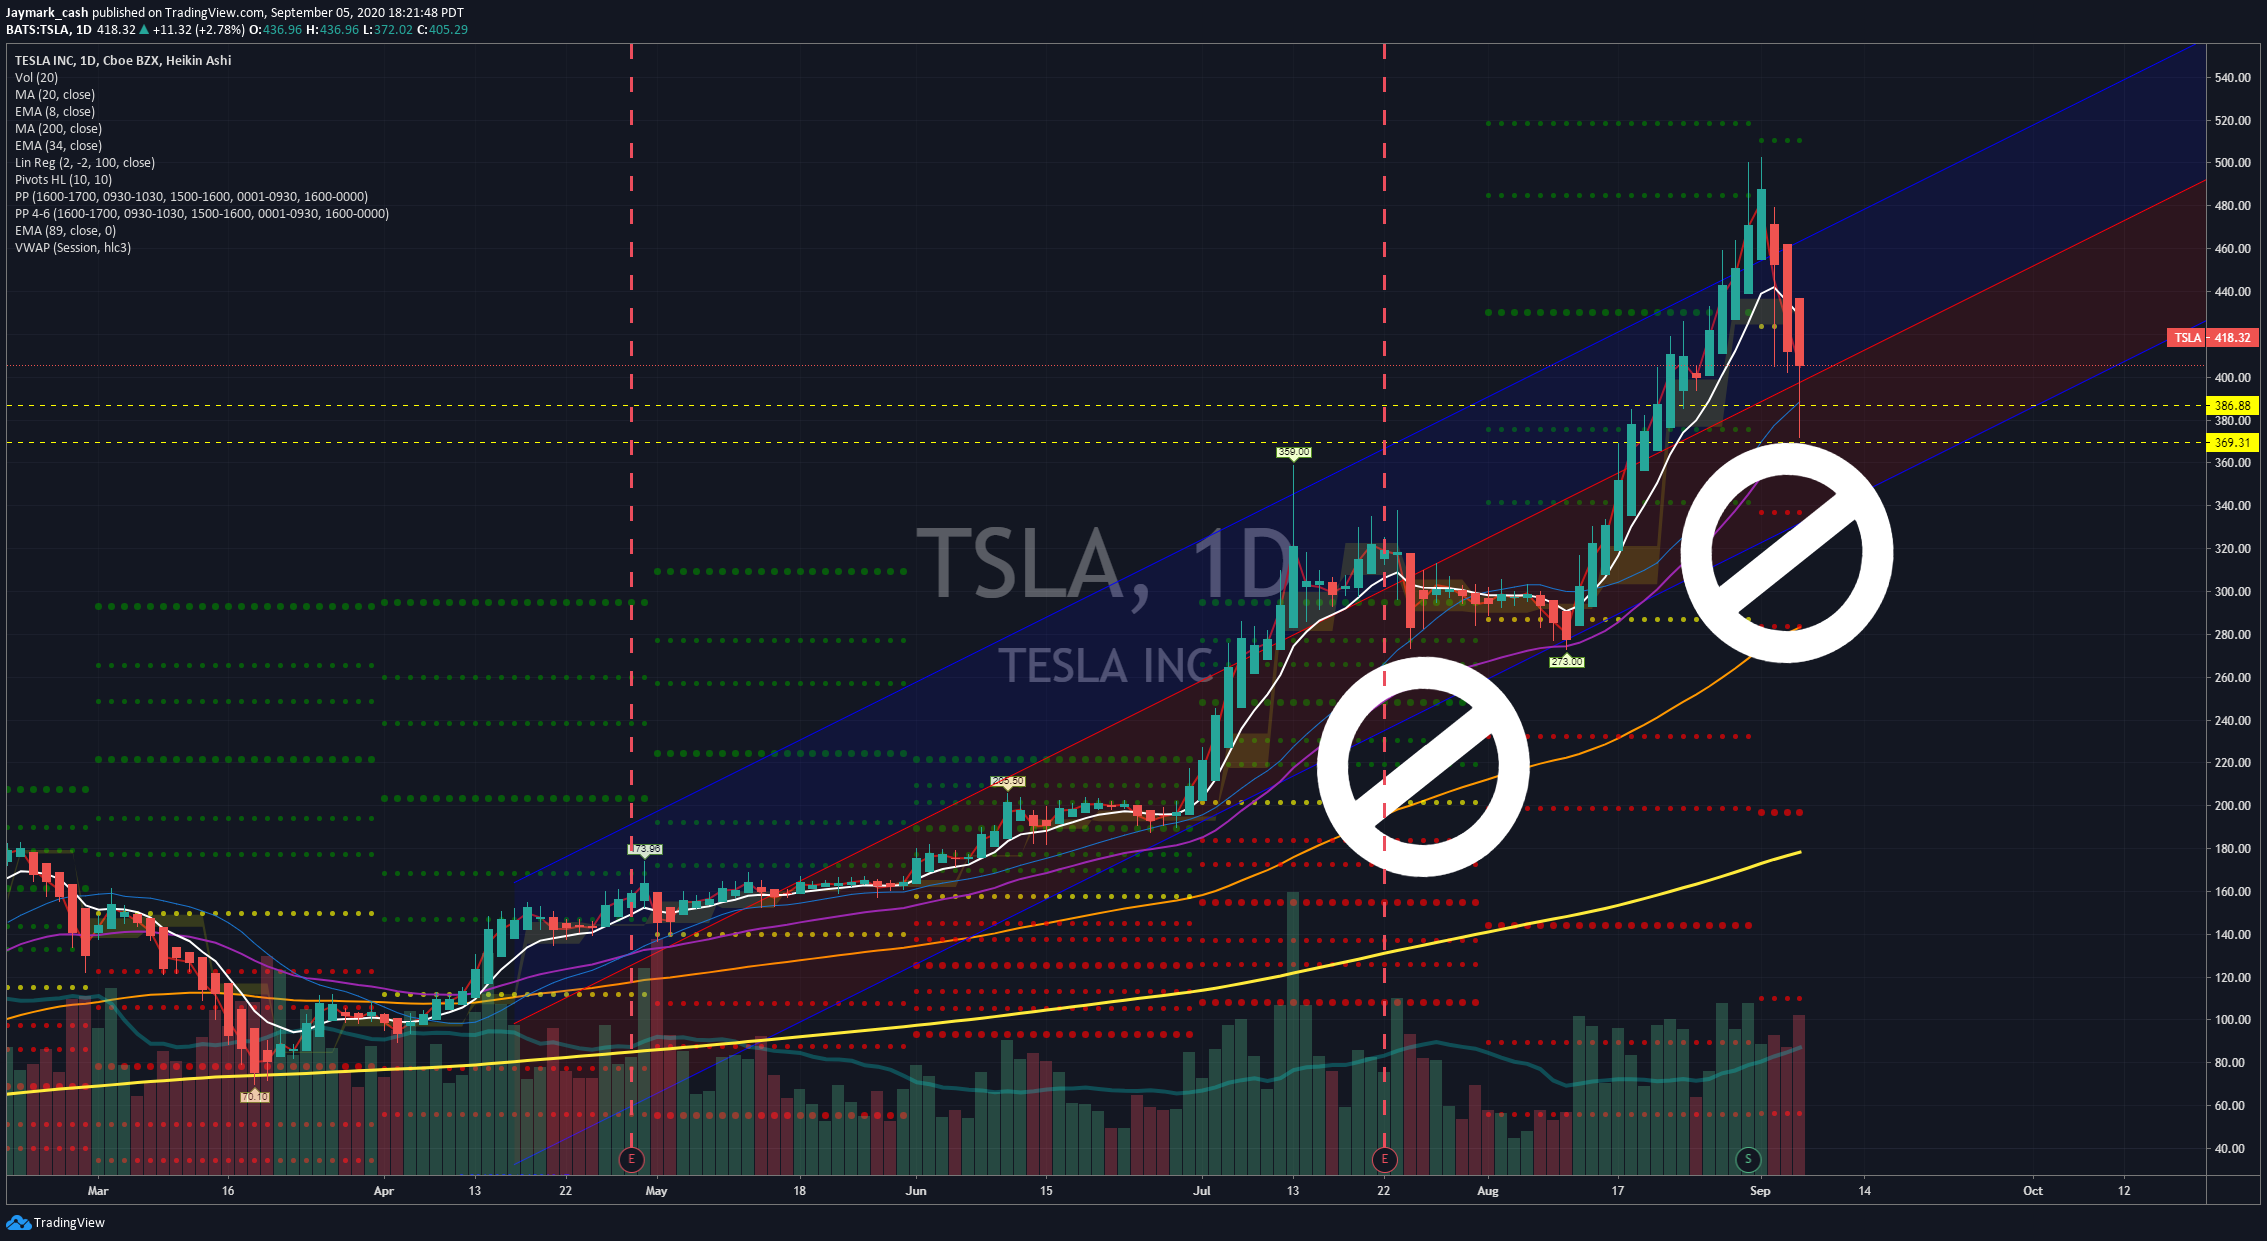
This is where we are in Tesla. We started off with ATH (all time highs) and suddenly just sold off. Part of it was people taking profits and hedge funds started to sell our their positions due to stock portfolio.
What we also have to remember was it did run up fairly quickly after the stock split. This is completely normal and I was calling for the split to actually consolidate. We don’t like it when stocks keep on rising up as it does not build a strong support line. If you’re bullish you want this stock to build more foundation so when it drops at days like these, it was a place to bounce from.
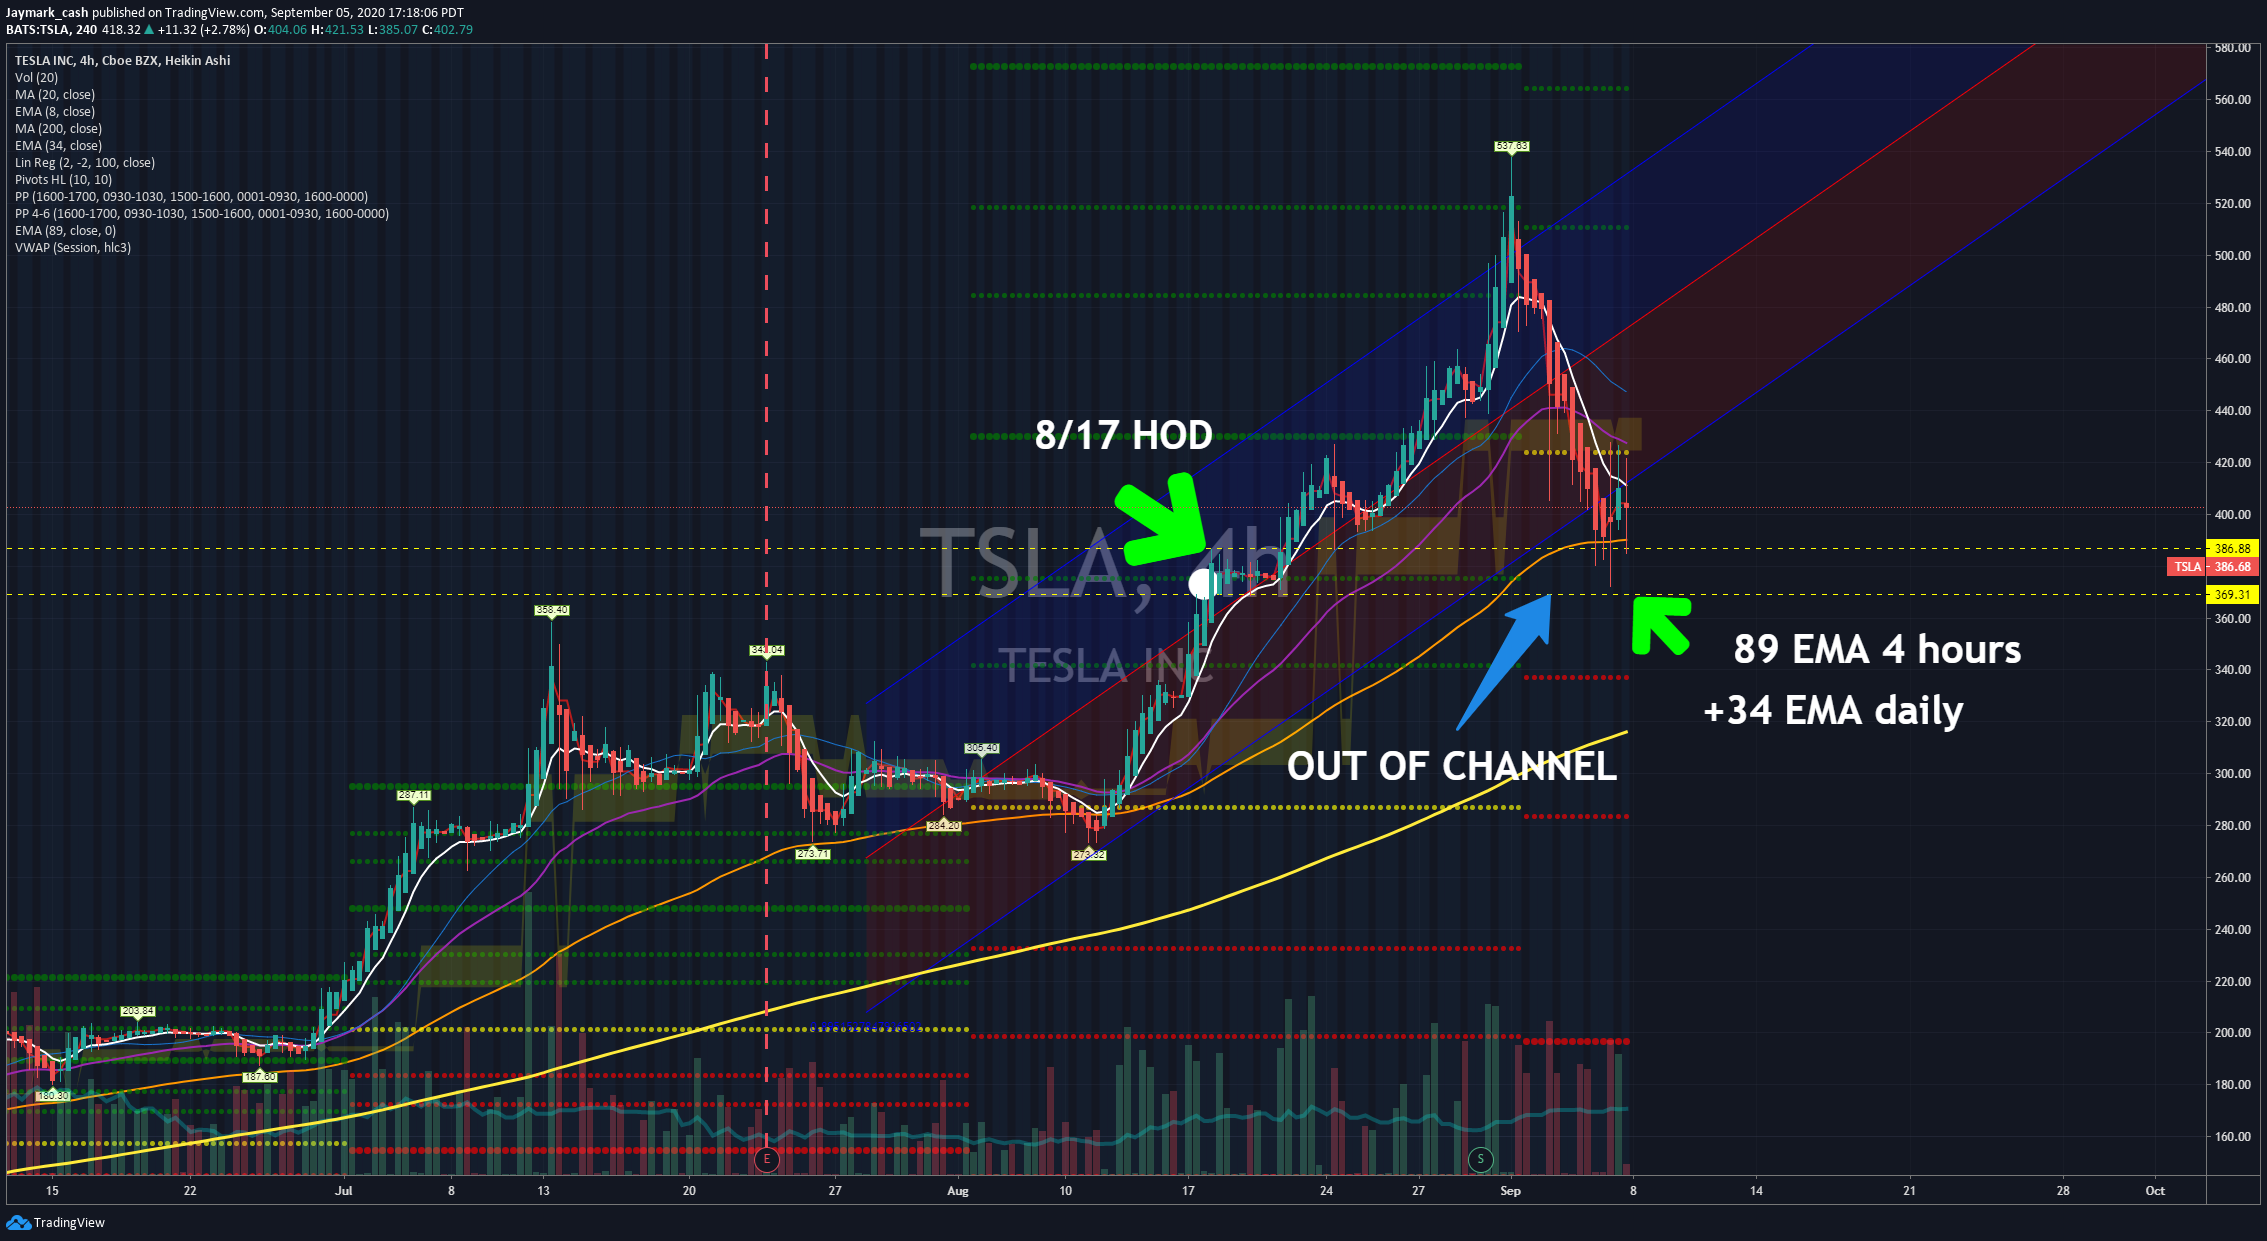
So we can see on the drop that it bounced off the previous resistance that became support in 8/17.
Here’s a few things on TESLA’s support level at these points
- In the 4 hour it comes out of the linear regression channel and tries to close above it
- It dips below the 89 EMA but quickly turns right back
- On the daily chart (not shown) it bounces off the 34EMA.
- Our next support level would be around $423 area since it rejected in the floor trader pivot and is also currently rejecting the 34EMA in the 4 hour chart.
Our next major support levels is $370 level.
If that doesn’t hold we are looking at dropping around the $350 but if TSLA decides to drop there, it’s pretty much open. There is NOT a strong support level between $370 and $340. By coincidence this is also an area of a Fibonacci pivot
There is just not enough support in those levels, but TESLA does TESLA meaning, who knows what can happen.
Ideally what I’d like to see is a consolidation period between $370 to $400 on the lower end. This was only due because AH on 9/4 Friday it did dip under $390.
But if we continue on where were were before market close, we should consolidate around $400 to $425.
I want to predict that TESLA can go as low as the $340 area.*
However in a bullish case I’d like to see it $430 range *
** Before battery day.